





It’s been all too common to read that “stocks ignored the bearish move in bonds.”
While that’s been true at times, the bigger picture doesn’t support it, and ignoring it could be costly.
The cost could come from both being in the wrong trade or missing the opportunity to enter new trades early as they are developing.
This week we’ll look at the effect bonds have had on stocks and an investment theme that’s looking promising after being pulled down by the bear market – in stocks.
This week’s Outlook is another example of the quote shared a few weeks ago,
“It ain’t what you don’t know that gets you into trouble.
It’s what you know for sure that just ain’t so.”
– Mark Twain
There’s Nothing Stealth About This Bear Market
The S&P 500 is up about 13% for the year, but only 32% of the 500 stocks are outperforming the index.
The equal-weighted S&P 500 ETF (RSP) is up about 9.5%, but only about 38% of stocks in the index are outperforming it.
It’s been a tough year for the average stock:
- 50% of the S&P 500 is down for the year
- 29% of the S&P 500 is down more than 10% year-to-date
In other words, if your stock selection isn’t outstanding, your stocks aren’t keeping up.
Maybe that’s why the AAII investor sentiment recently hit a new 52-week high in bearish sentiment?
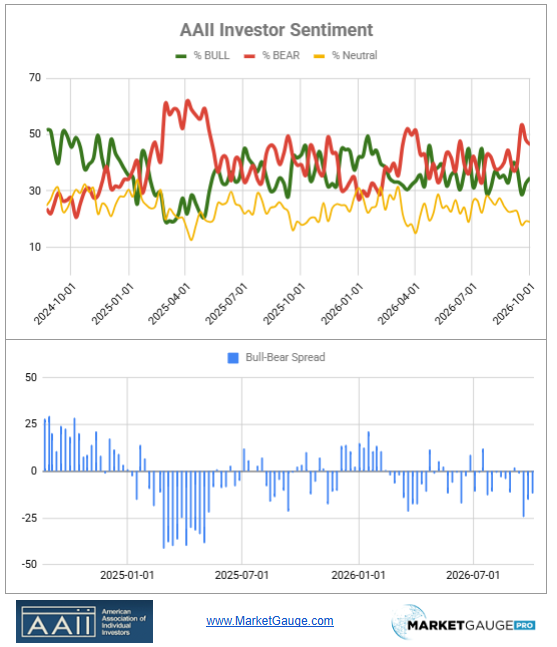
The spread between bulls and bears also declined to the same level from which the Iran war bottomed in April
While the broad market year-to-date performance numbers are discouraging, the bear market worth focusing on isn’t measured in terms of year-to-date.
The trend to focus on is the increasing pressure that higher interest rates are having on the broad market with each new leg down in bonds.
Additionally, when you consider the broader market pullback from the 52-week highs, the damage to stocks is more pronounced.
For example,
- 40% of the S&P is in bear market territory (20% below its 52-week high).
- While the SPY is about 1.25% from its 52-week high, only 7 other stocks are closer to their 52-week highs, and only about 7% of the stocks in the index are within 5% of their 52-week high. It’s lonely at the top.
2026 has been a period when the war pressured stocks and bonds, and then bonds continued to pressure the broader market.
Bonds have fallen for very legitimate reasons:
- Inflation fears led by higher energy costs
- Increased supply of private debt offering led by the AI build out
- Strong economic growth globally
- Renewed attention to and concern about the federal deficit
In the chart below, you can see that TLT has had a stair-step decline in price, reflecting rising rates. At the same time, the SPY index has managed to work its way higher when the TLT rallies or goes sideways, but the percentage of stocks staying above their 50-day (blue) and 200-day moving averages (green) has been accelerating lower.
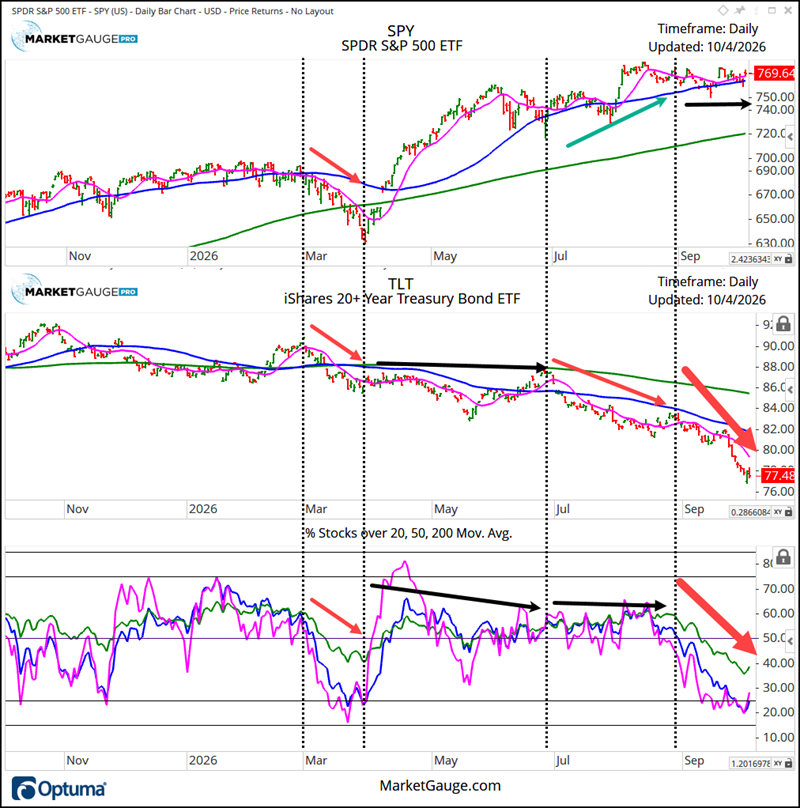
The chart makes it clear that the last push lower in TLT (which results in higher rates) has had an increasingly bearish impact on S&P 500 stocks failing to stay above key moving averages, which means they are not just going down; they’re breaking down as stocks do in bear markets.
Why Be Bullish?
Last week’s Market Outlook,”September Changed The Market Narrative…”, laid out a bullish playbook for the fourth quarter, and that still stands. It focused on what’s working – high relative strength, durable price trends, and preferably part of the bullish narrative.
If you didn’t see last week’s article, its perspective is important context relative to this article on the “stealth bear market,” because it’s important not to ignore the very strong bull market also underway.
The question here for the fourth quarter is, “What will the rest of the market do?”
The Indexes Are Near All-Time Highs.
Will The Broad Market Catch Up?
In the spirit of MarketGauge’s discretionary trading approach, you don’t need to predict the next move when you can identify the conditions that will indicate the bear market is ready to bottom and change the nature of the bull market.
The first step is to recognize that the bear market even exists.
A bear market can reset investor enthusiasm, reduce valuations, and set the stage for a renewed broad-market rally in the coming quarters. All of this has happened over the last several months and quarters.
Why The General Market May Bottom
Since the market’s price action is still going down as of last week, the suggestion here is that there are several reasons to look for price action to stop falling, start basing and potentially reverse.
Here are a few reasons why the timing and location of the markets are ripe for a bottom to form:
- RSP and IWM are near or at their 200-day MA
- Sentiment and expectations for the next Fed hike reversed sharply after the employment report on Friday.
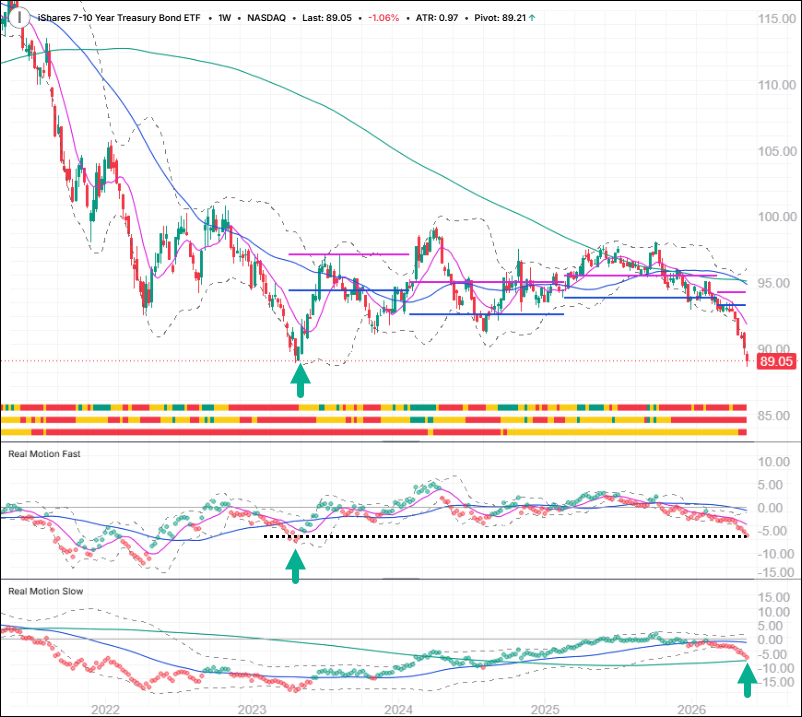
- 10-year rates as measured by the 7-10 Yr bond ETF (IEF) are at the level at which they bottomed in October of 2023 (see chart below).
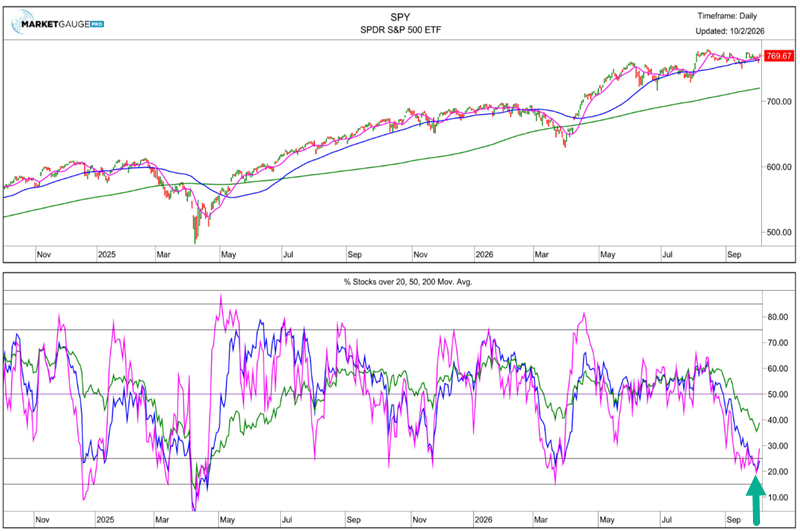
- The percentage of stocks under the 20, 50, and 200-day moving averages are all at oversold levels (see chart below).
- Earnings season could potentially shift investors’ attention away from rates and onto the theme driving the bullish stocks higher – earnings growth.
- Governments around the world are focused on reducing the price of diesel fuel which is a major factor in inflation fears.
In short, there are factors shifting investors’ sentiment around the bond market, and market trends are at both oversold levels and levels of technical support.
More specifically, sentiment on the Fed’s hawkish stance has spent the last couple of months getting progressively more bearish for bonds, and that flipped last Thursday and Friday. After Friday’s employment report, Fed Funds market-based probabilities for another rate hike in October plunged to about 23%, down from over 60% a week earlier.
The chart below shows the ETF that represents the 10-year bonds at the level of support based on the 2023 low around 89.
For an interactive chart click here
If you’re familiar with the Real Motion indicators on the chart above, you’ll also notice that the bottom chart is on its 200-period moving average, which is a normal place to find support.
Momentum in the IEF, as measured by Real Motion, is oversold and at support; at the same time, price is at support.
In the chart below, you can see the IWM on its 200-day MA, which has been a reliable support level in the past. Additionally, you can see that the % of stocks under the 20 and 50-day MAs is at a reliable oversold level.
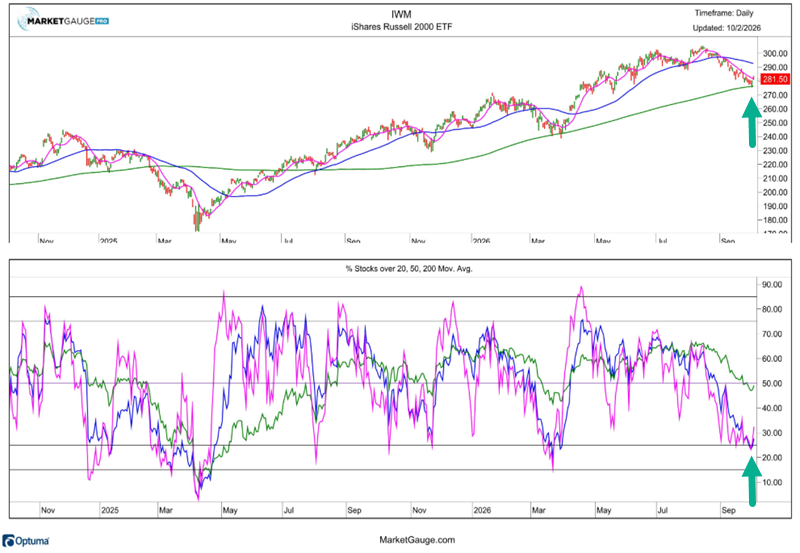
The chart below shows the SPY % of stocks under the 20 and 50-day MAs at a reliably oversold level.
You can find both of the charts above in Big View here
The Next Step To Become Bullish On the Broad Market
The RSP, IWM and bonds (IEF) are all in the right location to look for a base or bounce to form. Now we need price action to tell us there is real support here. Keep your eyes on the charts!
Opportunities In The Wreckage?
Additionally, bear markets always expose market themes that become the next “bull market opportunity” before the general market improves.
Last week, the space theme may have reached a bullish inflection point.
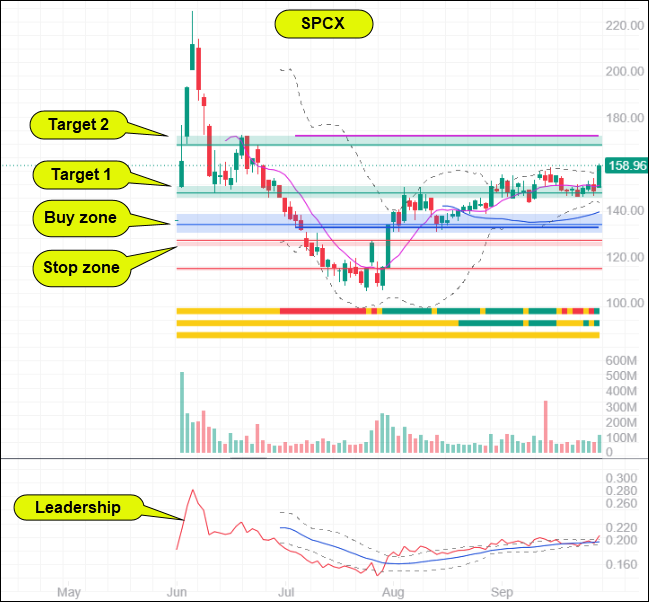
SPCX has been one of our long positions in the opportunity report since $139, and you can see the trade mapped out below. On Friday, it broke out of a consolidation pattern that has formed over months around the pivotal $150 area.
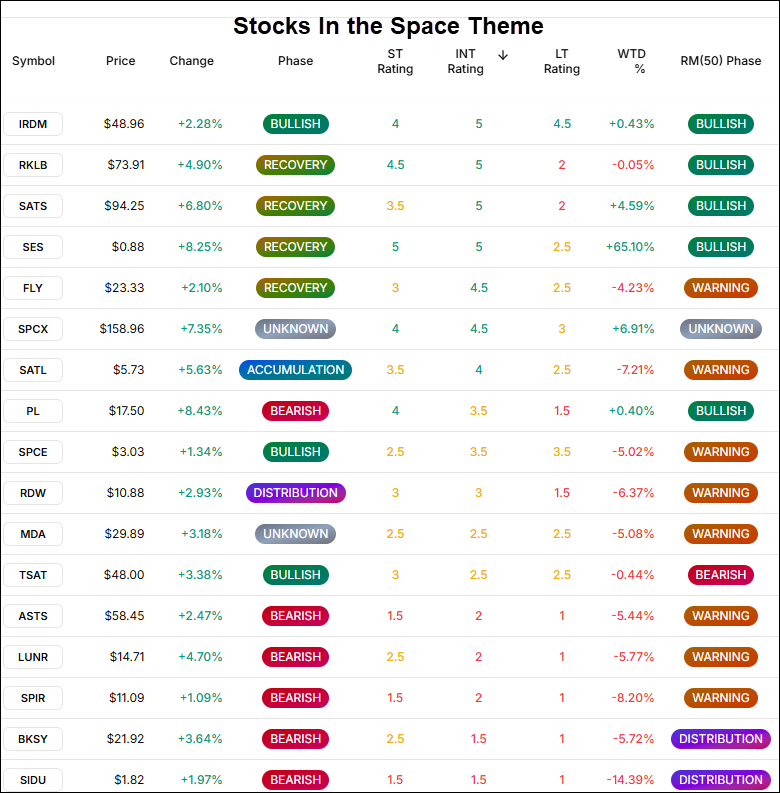
Looking at a broader list of stocks in the theme below, you can see several have developed bullish PRIME ratings. Additionally, the column called “RM (50) Phase is a measure of the faster momentum indicator. If this is bullish or warning it is an indication that if price moves from under the 50-day to over, it is likely to continue.
The table suggests there are some interesting bullish bases in the space theme!
Want More MarketGauge?
If you’re an individual investor or an advisor, and would like help navigating the everchanging dominant themes in the market with strategies, tools, automated trading systems or professional advisory services, contact us:
- For individual traders or those who want access to professional-grade models: marketgauge.com/call, and ask Rob how to join our Active Investing Edge program
- If you’re an asset manager or RIA seeking algorithmic systems: email Ben at ben@marketgaugepro.com
- Use Big View (a lot of it is free!)
Best wishes for your trading,
Geoff Bysshe
Co-Founder
(Connect on LinkedIn)
 |
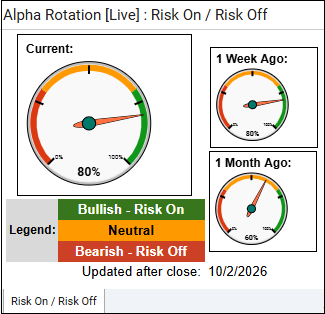 Every week we review the big picture of the market’s technical condition as seen through the lens of our Big View data charts.The bullets provide a quick summary organized by conditions we see as being risk-on, risk-off, or neutral. The video analysis dives deeper. Every week we review the big picture of the market’s technical condition as seen through the lens of our Big View data charts.The bullets provide a quick summary organized by conditions we see as being risk-on, risk-off, or neutral. The video analysis dives deeper. |
Summary: Markets remain broadly risk-on, led by new highs in the Nasdaq and semiconductors, low volatility, strong risk gauges, and slightly improving breadth and internals. However, weak sector participation, deteriorating longer-term breadth, and a sharp rise in rates remain significant concerns beneath the strength in growth and technology.
Risk On
- Major U.S. indexes were mixed with the exception of QQQ pushing to new highs this week. (+)
- Volatility is under its key moving averages and around its lowest levels for the year. (+)
- Growth remains in a bull phase led by semiconductors and hit a new high on Friday. (+)
- Foreign equities, led by emerging markets, still look relatively strong. EEM is roughly matching the S&P performance. Though more established foreign equities have dipped into a warning phase, testing their 200-Day Moving Average, and got a small bounce on Friday. (+)
- Risk gauges remain strongly risk-on. (+)
- Seasonal trends tend to strengthen into October. Gold tends to have a positive seasonal trend during this period as well. (+)
Neutral
- Market internals bounced off their lower levels to closer to a neutral reading. (=)
- Volume patterns were mixed, with no accumulation days in the S&P while QQQ was the strongest with 3 accumulation days and only one distribution day. (=)
- Semiconductors continue to lead along with related foreign countries. (=)
- The modern family is mixed, with Semiconductors the strongest overall and many members showing some improvement towards the end of the week.(=)
- Soft commodities pulled back off their highs, dipping below its 50-Day Moving Average. Copper is consolidating and compressing at high levels. (=)
- Gold is starting to look heavy. Oil is maintaining a bullish stance, but could break below its 50-Day Moving Average. (=)
- The dollar is at its highest levels since April, 2025 and may be contributing to metal weakness. (=)
- The percentage of stocks above key moving averages saw a jump off the lows, signalling a potential bottom. (=)
Risk Off
- Sectors skewed negative again this week, with notable exceptions in technology, energy and transportation. (-)
- New high new low ratio continues to be weak, sitting around its lowest levels for the year. (-)
- Rates hit new 20-year highs with a sharp move lower in bonds this week. Speed of move continues to be concerning. (-)
- The color charts (moving average of stocks above key moving averages) are showing weakness across the board with even the 200-Day relationships weakening. The Nasdaq is showing some early signs of improvement. Two out of the three are clearly risk-off. (-)
Actionable Trading Plan
Maintain a risk-on bias but stay selective, favoring technology, semiconductors, and other areas demonstrating clear relative strength while allowing winning positions to run. With participation still uneven and rates moving sharply higher, avoid aggressively expanding exposure until broader sectors and longer-term breadth improve; keep some cash available and use weakness in leading areas for measured entries rather than chasing new highs.
Continue to monitor QQQ and semiconductor leadership, market breadth, and the bond/rate move for confirmation or deterioration. Add exposure if improving internals broaden into more sectors, but reduce risk if technology leadership breaks, breadth rolls back over, or rising rates begin to pressure the major indexes more broadly.
Keith’s Weekly Market Analysis Video
**This is today’s video. Please note that the date shown on the title slide is incorrect.**