

Last week, the news flow around tariffs rocked the markets like small craft in stormy seas, and the end result has become an uncomfortable trend.
The SPY closed with the worst 3-week slide since Dec 2022. This makes it the worst 3-week slide of the current bull market. At the low for the week and Friday, the pullback from the all-time highs measured over 7%.
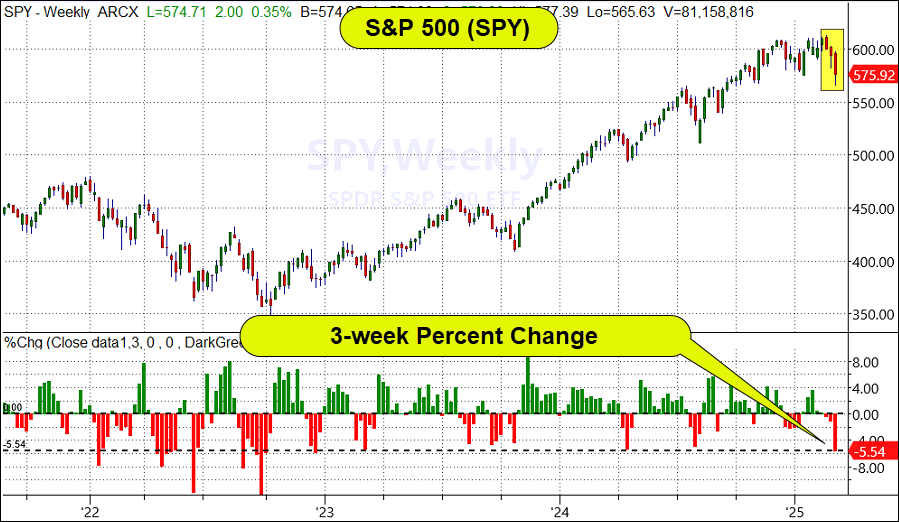
Nasdaq’s performance based on the QQQ was similar but more volatile. It had its second worst 3-week slide of the bull market behind last August’s tech rout, and at its low on Friday, the drawdown exceeded 11%. Wall Street labels a move of down 10% or more as an official “correction.”
The $64,000 question is, “Will the administration’s policies relating to tariffs create a bear market?”
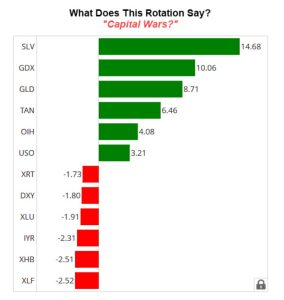
Considering the amount of tariffs proposed as shown in the chart below, it’s understandable that investors, the Fed, and even the administration would be considering this question seriously.
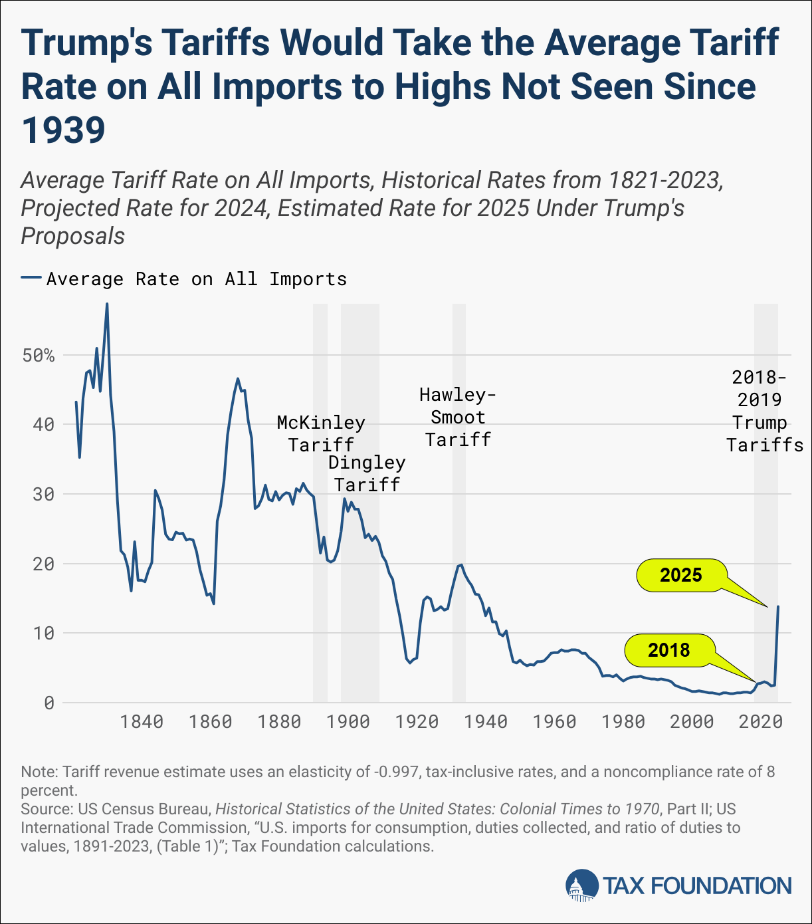
Last week, each of these three parties independently demonstrated there is some common ground in their belief on how markets will respond to the current execution of tariffs.
In his address to the nation, President Trump described them as potentially creating a “little disturbance”.
On Friday, in a speech that seemed to instigate a market reversal at the low of the day, Chairman Powell described the path forward for markets and data as “bumpy.”
Wall Street strategist have a long-standing definition for describing markets that decline 10% from their highs, “Corrections,” and the QQQ earned that designation last week.
The volatility wasn’t limited to the stock market. The dollar index had its biggest one-week decline since 2022 which (not coincidentally) solidified the top in the dollar’s uptrend that began in 2011.
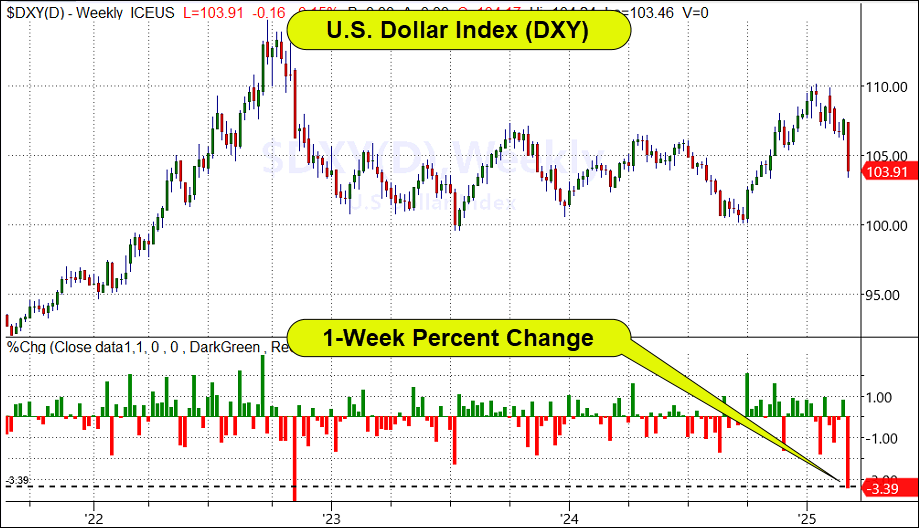
The dollar’s move was led by the Euro’s biggest one-week up move since 2009, show below.
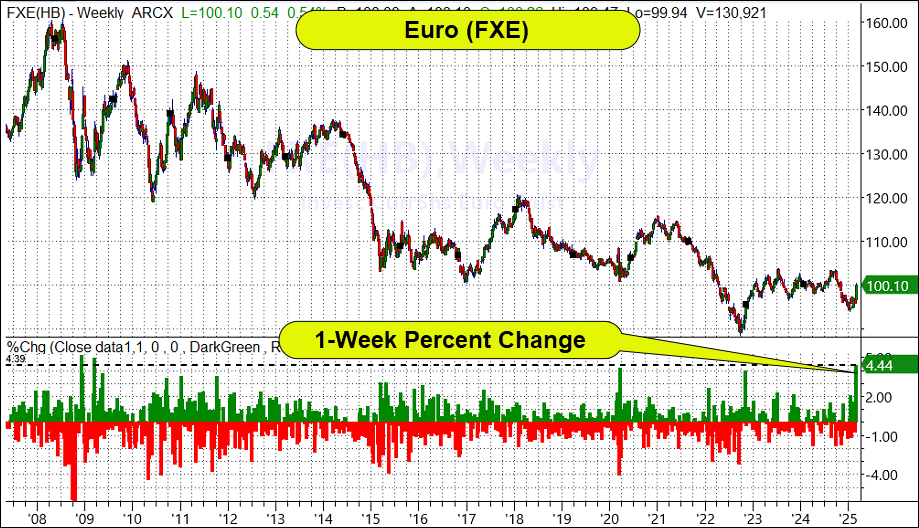
While these moves in the currency market were not attributed to the tariff news last week, their timing is uncanny, considering that one of the ways markets can enhance or diminish the impact of the Trump tariffs on growth and inflation is through currency moves. I expect the media will pick up on this if the decline in the dollar continues.
Tariffs, Growth, Inflation and Stocks
Speaking of growth and inflation, over the last few weeks, this article has pointed to the apparent linkage between the consumer’s expectations related to growth, inflation, tariffs, and the direction of stocks.
Following, up on last week’s commentary on the weakness of the consumer discretionary sector (XLY) and the suggestion to watch out for any turn lower in the consumer staples sector XLP, XLY continued to lead the market lower last week, resulting in its worst 3-week decline since 2022, as shown below.
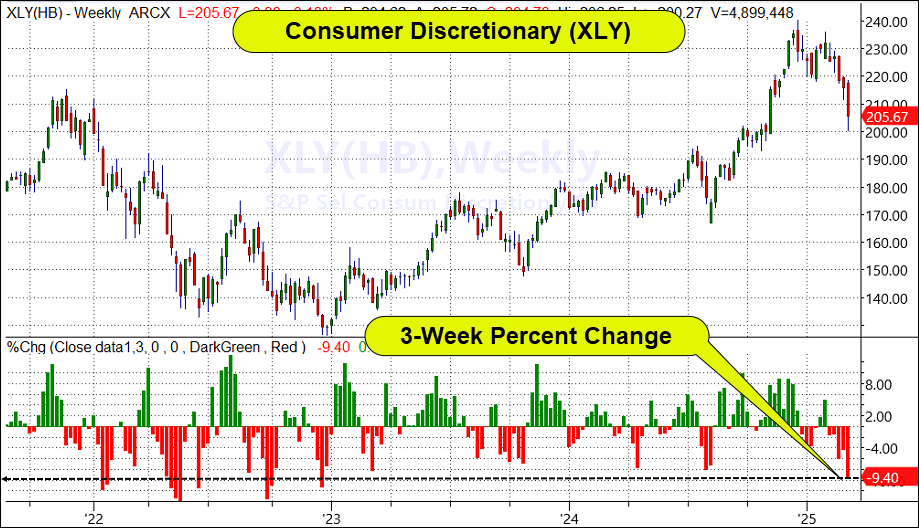
Fortunately, XLP did not turn lower, and ended the week down a modest -0.51%.
While it’s nice to see the President and Fed Chair comfortably agreeing that near-term volatility is a part of an optimistic long-term plan, that doesn’t answer the questions you most likely care about most.
For example:
- How will you know if the volatility is going to get worse?
- How long will this volatility last?
- What should you do to protect and grow your wealth in this environment?
The answer to those questions lies in the answer to the question of will the administration’s tariff policies lead the economy into a recession or a serious fear of a recession in the hearts and minds of investors.
While a true recession would arguably end the bull market, the damage to your portfolio will occur long before the recession is declared “official.”
In fact, it’s most likely that the market decline you’d like to avoid will occur as the market embraces a real fear that a recession is highly likely. At that point, the market’s downside volatility will get bigger and last longer.
So how can you stay ahead of real recession fears?
It can get complicated – tariffs, interest rates, currencies, the Fed, the unusual governing style of Trump, the Ukraine war, disruptive technological innovation in crypto, AI, pharmaceuticals, and more!
Last week I heard one analyst say that this bull market has persisted through 7 “recession likely” periods. I’d believe that number, and every time the market pulls back on such fears, it presents a credible buying opportunity.
In this article, we seek to simplify effective insight into the understanding of how the direction of stock prices is driven by investor sentiment and positioning, interest rates, earnings growth, and economic growth. Those factors are, in turn, greatly influenced by fiscal policy, monetary policy, consumer demand, financial conditions, and employment.
If you watch how the market responds to the most prominent of those forces, you can understand and anticipate its movements,
Sometimes, however, all this can be boiled down to a very clean method of analysis that does a great job of keeping you on the right side of the major market trend.
It’s a simple way to let the market tell you the answers you’re looking for.
More importantly, it can help with two big problems investors face:
- Not taking steps to reduce losses during major bear markets.
- Exiting the market during a sell-off and then never re-entering and ans a result, missing the bull markets.
The time for this simple market timing method is right now!
With the market (the S&P 500) in a strong bullish trend, as measured by the 200-day moving average, there is a simple formula you can use to methodically determine how bullish, neutral or bearish you may want to be.
More importantly, this formula can be used by the discretionary trader as a guide for when correcting markets may become collapsing markets and when recovering markets may be ready to be re-entered.
In the charts that follow, I’ll use weekly data and a 40-week moving average to approximate the 200-day moving average. Either time frame can be used as the thresholds are guidelines.
In the chart below, you can see the weekly market performance with the 40-week moving average in green. This method suggests that you should not turn bearish until the 40-week (or 200-day) average is substantially broken (shown in yellow).
When the market closes 5% below the 40-week average, the yellow bearish periods begin. When the market closes 3% above the 40-week MA, the yellow (bearish) period ends.
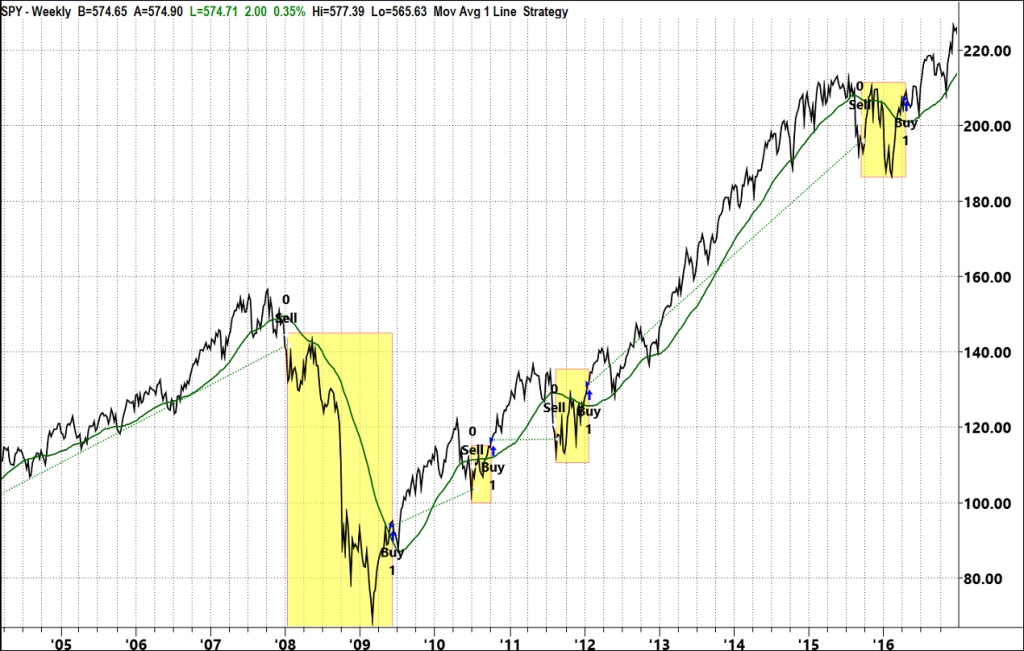
As you can see by scrolling through the charts below this simple rule will help you:
- Avoid every major bear market
- Have a timely rule to reenter the market
- Have a maximum frustration of 8% “missed opportunity” if the market immediately moves higher after you exit.
- Have the opportunity to buy dips to the 200-day (40-week) with a stop that can be 5% under the MA!
This bullish period begins is 1994 (not shown)
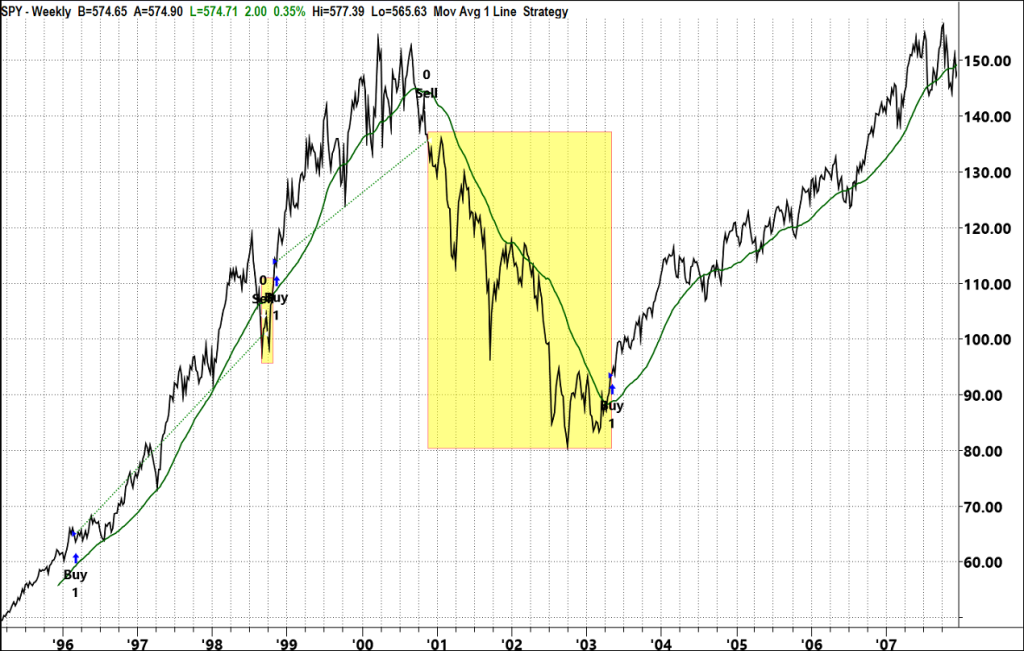
Each chart below has some overlapping time from the one above.
2013 to today (below)
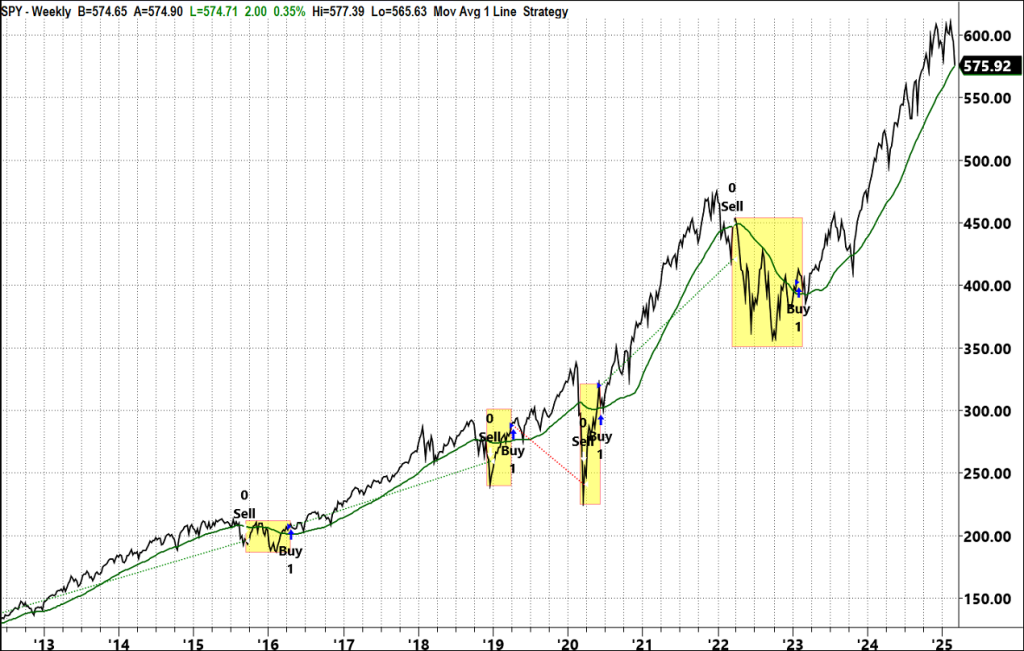
In summary, as the S&P 500 sits near its 200-day, rather than look at the average as an exact point, consider it an area where big players will look to either begin getting bearish or become opportunistically bullish. Until the market gets roughly 5% below the average, the trend is usually still intact, but under that level, much bigger declines have historically developed.
Once the market has exceeded the 5% negative threshold you want to be sure any bounce has strength and support under it. These charts show you what 3% over the MA looks like as that threshold.
In our discretionary trading mentoring we also use indicators like Real Motion to confirm moves through these MA will continue. For more information on Real Motion contact Rob Quinn at Rob@marketgauge.com.
Even if you are not actively trading, this simple method can enable you to answer the basic question of, “How bearish is all this tariff chaos for stocks?”

When markets get volatile and there’s more pressure on the question of should you ‘hold on’ or exit positions, the value of trading with automated systems becomes clear.
This is because automated trading strategies address two big reasons discretionary traders struggle over the long term. First, investors tend to get out of the market at the wrong time. Second, investors who exit positions without having a clear plan to reenter often don’t re-enter at a good time and compound the problem of taking losses and then missing the opportunity to participate in the subsequent bull market gains.
Without even getting into the details of market timing rules, automated trading strategies can ensure that you don’t make these two and several more common mistakes that can kill your long-term performance.
Automated trading will also ensure that in volatile times and when making position changes, you adhere to other important trading tactics that can make a big difference during market corrections, such as proper position sizing. diversification, and patience. If you’d like to learn more about trading with automated trading systems, contact Rob@marketgauge.com.
If you’re an RIA and would like to discuss using our trading systems for your clients, or you’d like a professional to manage some of your assets using automated trading systems, contact Ben Scheibe (ben@marketgaugepro.com).
 |
 Every week we review the big picture of the market’s technical condition as seen through the lens of our Big View data charts. Every week we review the big picture of the market’s technical condition as seen through the lens of our Big View data charts.
The bullets provide a quick summary organized by conditions we see as being risk-on, risk-off, or neutral. The video analysis dives deeper. |
Summary: Markets are at critical turning points with very mixed reads, as the bullets highlight below. A case could be made for strong mean reversion or a continued move lower.
Risk On
- The weekly trends in the NASDAQ, S&P, and Dow remain in bull phases, while IWM is in a warning phase. Friday’s reversal in the S&P could be bullish if confirmed. (+)
- European equities rallied strong this week. (+)
- Both emerging markets and more established foreign equities exploded to the upside, attacking the all-time highs set back in 2008. (+)
Neutral
- On the daily charts, the indexes appear to be breaking down, though all four indexes are oversold on Real Motion and could be poised for a bounce. The S&P tested it’s 200-Day Moving Average and closed slightly above it. IWM is in a distribution phase. (=)
- The number of stocks above key moving averages may have reversed course in the S&P and its also looking like potential bottoming action in IWM. If S&P we can clear the 50 percent level on both the 10-Day and 50-Day, that could be a positive sign. (=)
- In the modern family, Semi-conductors entered into a bear phase, though it is oversold on both real motion and price. Biotech held up in a recovery phase and outperformed the S&P over the last couple weeks. (=)
- The moving average of the number of stocks above key moving averages, on both the 50 and 200 are neutral, which considering the market action, is neutral for the markets. This is for the S&P, NASDAQ, and Dow. (=)
- Volatility remains elevated with the broader market sell-off. We are still under the peaks from last fall so this could indicate we are set up for mean reversion (=)
Risk Off
- Across the four indexes, we have only three accumulation days and 15 distribution days over the last two weeks. (-)
- The sector performance this week showed clear signs of risk-off with money flowing to risk-off sectors like gold miners and healthcare.
- The McClellan Oscillator is clearly negative and respecting an important trendline in this negative move, which could reverse, but for now, remains negative. (-)
- The new high new low ratio is still trending down, though its starting to get into oversold territory. (-)
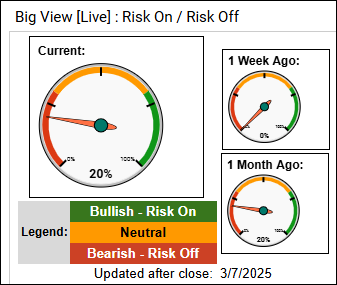
- Risk gauges improved from a 0% to 20% with an improvement in the wood vs gold ratio, possibly related to tariffs. (-)
- Value continues to lead growth, although it closed in a warning phase, and as long Value remains under its 50-Day Moving Average and growth remains under its 200-Day Moving Average, this reading remains risk-off. (-)
- Gold was up 2% on the week, closing just under all-time highs, exhibiting a traditional risk-off relationship to the S&P. (-)
- On the longer-end of the yield curve, rates rejected their 200-Day Moving Averages and retraced to important support, with no clear direction based on price action. (=)
- The dollar got crunched across the board against other currencies this week and is at its lowest levels since last November. Bitcoin, generally a good risk-on indicator, is under $90k. (-)
- Based on seasonality trends, we expect the markets to remain under pressure for the next week or two with an improving trend towards the end of the month. (-)