


- The record breaking 13-day Nasdaq 100 winning streak answers the question of the market being confident or complacent.
- As we reported for weeks leading up to the rally, market signals (price action, sector rotation, and inter-market relationships) indicated a bottom was forming, even as headlines remained bearish and uncertainty around war and inflation persisted.
- The “headfake” reversal near the 200-day moving average, which marked the bottom and signaled that the path of least resistance was higher, is “textbook” material worth reviewing.
You must have heard, but should you have seen this coming?
The Nasdaq 100 closed on Friday with its longest winning streak since 2013.
As you can see in the chart below (created on Thursday) by Ryan Detric from the Carson Group, 13 days is rare. Two more would be the longest since 1990!
Later, we’ll show that this strength hasn’t always meant smooth sailing ahead, but it is generally bullish, nonetheless.
More importantly, could you have anticipated the market’s rally, and what should you do now?
The Market Was Confident, Not Complacent.
Since the beginning of March, when the war in the Middle East began raging, oil and critical commodity prices have climbed at record rates, global trade has been increasingly disrupted, and long-standing geopolitical relationships have been fracturing.
At the same time, analysts have been raising earnings estimates, AI capital investment has been booming, and new AI capabilities with productive and disruptive implications have been announced almost daily.
All the while, the stock market discounts expectations of future corporate earnings growth, and its answer is reflected in price action.
As the market sold off, the bears described the slow pace of correction as complacency.
The bulls described it as confidence.
A Confident Bull Market Doesn’t Wait For The Fundamentals To Be Obvious
A confident bull market absorbs negative news, a complacent bull market gets caught off guard and freaks out.
Most weeks, this article focuses on what the market’s message is suggesting about the direction of the trend moving forward. Additionally, Keith’s weekly video shows how you can use our Big View charts (many of which are free) to follow his conclusions about the health and direction of the markets’ trend.
The stock market’s reaction to the war was like game of chicken between the bulls and bears with the rising prices of critical commodities like oil, fertilizer, and more being the pain that the bears were betting would break the bulls, while both sides surmised that oil prices would reverse if the war ended without too much long-term damage to oil producing infrastructure and global supply chains.
Looking back at the titles of our recent articles and then pulling the message together with the charts below provides a good summary of how the bulls won the game of chicken over the impact of the war.
The next game won’t be over the war, but it will involve similar analysis.
The Market’s Messages Leading Up to the 13-day Explosive Rally
The weekend the war began, March 1, Outlook’s focus was:
“Earnings Season Ends On A Down Note.
Next Up: Rates, Risk, and Rotation”
We wrote…
Last week, earnings season “ended” with a disappointing reaction to the much anticipated Nvidia earnings.
And concluded…
Historical safe havens (the U.S. dollar, Treasury Bonds, gold, etc.) and scarcity-driven resources (oil) are likely to be bid up initially. Stocks are a tougher call in the short-term, but a longer-term perspective suggests the war is less of a concern than the primary drivers of stock prices – consumer spending and corporate profits.
A week into the war, March 8th Outlook’s theme was,
“Was Last Week The Tipping Point For Stocks?”
We asked…
Last week was filled with more than a few small bearish events, but did they create a tipping point for the bull market?
We concluded…
The positive news is that last week, the bullish narrative enabled the bulls to be optimistic that the bullish trends in earnings expectations (we discussed this last week) and a stable state of GDP growth would enable the market to see through a temporary supply shock created by a “quick war” with Iran.
On March 15, with oil prices up about 50% since the start of the war, Market Outlook’s theme was,
We wrote…
Bull markets and strong economies are killed by “shocks.”
The difference between a problem and a shock can be measured in time and magnitude. I don’t think many investors would debate that the magnitude of the war with Iran qualifies as a shock. Now the question is, “How big will the shock be?” For the bulls looking for a resumption of the bull market,…
Time is running out.
We concluded…
In short, the data does not point to an economic collapse, but it suggests the economy may be losing momentum faster than previously thought. If growth fails to rebound as expected, the economy could shift from being a tailwind for markets to becoming a potential headwind for investors.
On March 29th, with The SPY and QQQ closing below their 200-day moving average, Market Outlook’s theme was,
“The Market’s Big Problem Is Persistence.
Why and When To Buy GLW, CIEN and…”
We asked,
How Will This Market Bottom?
There are three common ways market corrections and bear markets bottom out.
- The first is quick and violent capitulation.
- The second is a process of sector rotation, and
- The third is through a long depression of investor sentiment, combined with compressed price action.
We concluded…
The investors and the media are looking out for capitulation (number 1), but the market is saying it prefers rotation right now.
In other words, while the market is trading like a bear market and the media’s reports often sound dire, the market is not selling everything in a rush of capitulation.
If you’re only looking at the S&P 500 or NASDAQ 100, it may feel like capitulation is underway, but the broader market tells a different story.
After what felt like the longest March ever, On April 5th, Market Outlook was able to report,
“Watch Out! Last Week Was Different.
Space Stock (SATL) Takes Off, and Energy Stocks Fall.”
We highlighted…
With the war taking center stage, it was easy to overlook the economic data that was surprisingly optimistic if you’re focused on growth, but less so if you’re worried about inflation. Was this what disrupted the stock/oil correlation?
We concluded…
Last week was chock full of “firsts” and “changes” that may turn “green shoots” into the next major market narrative.
The break in correlations with oil made last week’s price action very different and potentially bullish. The size of the move was also impressive.
The next “first” we’ll be looking for in our trading room will be a weekly close significantly over a prior week’s high. That hasn’t happened in the SPY or QQQ in 2026. That’s a simple first sign of a durable reversal.
With the war in focus, it was easy to overlook the economic data that was remarkably optimistic if you’re focused on growth, but less so if you’re concerned about inflation.
With the stocks already rallying before the cease fire the question on investors minds was, “bounce” or “bottom”? Our answer in Outlook last week was,
“War, Inflation – No Problem
Next Challenge – Earnings”
We wrote:
The ceasefire gave the stock market the “move past the war” catalyst it had spent the prior week preparing for. The next hurdle will be the wave of bank earnings this week.
We Concluded…
In last week’s Market Outlook, we highlighted the market rotation that was forming a bottom, and economic news that could support a more bullish market narrative.
This was supported by the fact that the bond market had also stopped going down in the face of higher crude prices and other news that would normally put pressure on rates to move higher.
The market was ready to rally before the ceasefire news so the welcome catalyst created a strong rally that held up and followed through in the indexes and several key sectors.
The war’s market bottom is in. Now it’s up to earnings to keep the bull market intact. With earnings taking center stage, the economy, interest rates, and inflation will be the supporting cast of characters.
Here’s How The Market Narratives Above Played Out In The Charts
Even before the new year starts, I start talking about which indexes, sectors and stocks will likely be good opportunities based on the trading tactic we call Calendar Ranges. The big ones occur in January and July, and they are based on 10 days – not the whole month!
These ranges are illustrated on each of the markets in the chart below. The simplest application is to be bullish above the Jan. Calendar Range (CR) High (green) and bearish below the CR Low (red). Additionally, you look for confirmation between instruments, as you’ll read below the chart.
The weekly narratives described above were also supported by and discussed in Market Outlook articles, but the progression in 2026 from neutral to slightly bearish, and finally to bullish for stocks, can be described like this.
- 2026 began with a neutral bias as stocks did not break out of their January high.
- In February, big tech dragged down SPY and QQQ as the equal-weight S&P (and IWM not shown here) broke out to the upside, following the lower rates as bonds (TLT) broke out higher.
- When we attacked Iran in the beginning of March, TLT and IWM topped out and fell back into their January ranges. QQQ and SPY (not shown) held their already weak position relative to their January range low. Oil (USO), which was already in a bullish position over its Jan. CR High jumped and continued higherAs the war escalated throughout the month of March, and oil remained high. Bonds traded lower consistently as the duration of the war is likely to be related to the future duration of its inflationary effects.Stocks fell reluctantly, and sector rotation created a slow but highly correlated correction between stocks, bonds, and oil. Higher oil prices pushed bonds down, which pushed stocks down.
- In late March, oil pulled back from its highs, contrary to recent correlation, bonds fell too, and so did stocks. Within a few days, oil resumed its uptrend and broke out to new highs, but the oil-stock correlation was broken. Stocks were rallying too!
- On the new move up in Oil, bonds did not move to new lows and stocks took notice. Stocks and bonds were signaling that they had priced in oil at the elevated levels.
Stocks adapt to new interest rate levels quickly. It’s quickly changing interest rates that create the problem. If rates were done going down, then stocks were ready to go up.
As a result, the rally in stocks began.
You Don’t Need To Be Macro Market Analyst (just read the charts)
While this inter-market relationships dance was playing out, you didn’t need to look any further than the market index charts (SPY, QQQ, IWM, and DIA or RSP), to see the evidence that the bottom of the correction was near.
Below you can see the same story from another perspective.
- The QQQ actually peaked in late October 2025. Last week was the first time it exceeded that high. This high correlated with a high in TLT that was roughly in line with the 2025 high in TLT.
- The lack of a new high in QQQ is relevant when you consider that the SPY, IWM, DIA (not shown), and RSP all made new all-time highs in Jan 2026. Leadership had rotated away from QQQ and broadened out as evidenced by RSP breaking its Jan CR High.
- The previous leader, QQQ, broke its Jan. CR Low and its 50-day MA. This is a sign of weakness.
- The SPY broke its Jan. CR Low and its 50-day MA. This is another sign of weakness, but the correction is still less than -10%, above its 200-day MA, and the broader market represented by IWM and RSP had not broken their Calendar Range Low.
- The “headfake” at the 200-day!
A capitulation low is much more dramatic or violent than the pattern we saw on the last day of March, which also concluded the first quarter.The “headfake” pattern low is a big range down day that closes near the low of the range, followed by an open that is near or over the prior down day’s high.Here’s the SPY’s example, AND every stock index had this pattern!
This pattern says, “buy my breakout, and set your stop below my low or the low of the correction”.
When it occurs at the 200-day MA for the IWM and RSP, you can’t ignore it.
Furthermore, it created a reversal at their January Calendar Range lows and 200-day MA.
- Every seller from the day before feels duped.
- If you’re short, you’re uncomfortable.
- If it happens in an area that represented a break of major support (as was the case at the 200 DMA of the IWM and RSP), the savvy active investor knows the bears are trapped, and there’s a well-defined risk in getting long.
- The additional nuance here is that the two broadest indexes had this pattern at the 200-day MA, and the two weakest indexes (SPY and QQQ) had the same bullish pattern.The stock market was saying that the correction low was defined on this day so long as the next day didn’t completely reverse it.
All this happened days before the ceasefire gap higher.
The ceasefire would almost certainly create a positive reaction, but the fact that the market was already clearly looking beyond (or anticipating) the ceasefire meant the reaction to the ceasefire would continue.
What’s Next
Late Friday, Iran announced that the Strait of Hormuz was closed.
This should be bearish as it’s potentially a break in the ceasefire, but on Sunday morning, the administration announced that talks with Iran would be held again in Pakistan on Monday.
Right on schedule.
Have you noticed the administration’s ability to announce news that the market should interpret positively on Sundays?
One of Iran’s tactics is to keep oil prices high to hurt the administration and the US consumer.
What we’ve said above demonstrates that higher oil prices are harmful and so are expectations of future higher prices!
As a result, part of the war effort is the administration’s jawboning of the markets to expect and encourage lower oil prices and higher stock prices.
Don’t Let The News Distract From What the Market Is Telling You
Listen to the news and media, but let the market’s interpretation or “message” that comes from it drive your active trading decisions.
The war will create speed bumps, but currently, until it creates fears of a recession, it’s a nuisance, not a reason to expect a major correction unless the market drops back below the 200-day MA. This would suggest there is a problem you need to focus on.
The 13 Day Streak
Above, we suggested that the 13-day streak is not an ‘all clear’ signal.
As you can see from the table below provided by the Carson Group, I could have focused on “100% bullish” over the next 12 months, but 1, 3, and 6-month returns are much less impressive.
The encouraging stat from the table above is that if the market is higher 3 months later, it tends to be higher 6 and 12 months later.
Earnings Will Be The Driver And The Banks Delivered
As we said in last week’s Outlook, earnings season is likely to be the biggest driver of the trend over the coming weeks. Last week many of the major banks reported.
As you can see from the table below, all of the banks listed beat EPS estimates, and most beat their revenue expectations.
Most importantly the market’s reaction was mostly bullish.
Off To A Good Start
Earnings season is off to a good start.
For the first time this year, all the major stock indexes are above their January CR High, except the Dow (DIA), which stopped at its CR High.
This broad multi-index breakout is bullish. If or until the markets close below their January calendar range highs, the bull market is headed higher.
Want Help Making Sure You See What’s Coming?
If you’d like access to the MarketGauge indicators, strategies, automated trading models, and more, contact us.
- For individual traders or those who want access to professional-grade models: marketgauge.com/call, and ask Rob how to join our Active Investing Edge program
- If you’re an asset manager or RIA seeking algorithmic systems: email Ben at ben@marketgaugepro.com
- Use Big View (a lot of it is free!)
Best wishes for your trading,
Geoff Bysshe
Co-Founder
(Connect on LinkedIn)
 |
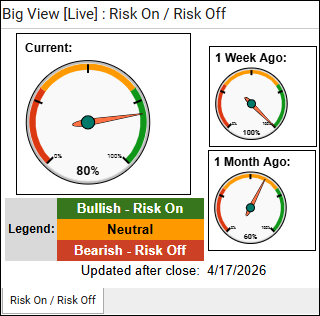 Every week we review the big picture of the market’s technical condition as seen through the lens of our Big View data charts.The bullets provide a quick summary organized by conditions we see as being risk-on, risk-off, or neutral. The video analysis dives deeper. Every week we review the big picture of the market’s technical condition as seen through the lens of our Big View data charts.The bullets provide a quick summary organized by conditions we see as being risk-on, risk-off, or neutral. The video analysis dives deeper. |
Summary: Markets surged into new highs with broad participation, strong accumulation, falling volatility, and leadership from growth, confirming a powerful risk-on environment supported by both domestic and global strength.
However, short-term internals are becoming stretched with overbought readings and key assets like commodities, gold, and rates at potential inflection points, suggesting the rally may face near-term consolidation or pauses.
Risk On
- Markets put in an explosive week, with 3 of the four indexes making new all-time highs. On price, all of the markets are hugging the upper bollinger bands though they are not overbought on real motion. (+)
- Volume patterns are confirming the bullish move with 5+ accumulation days in all the indexes and only one distribution day between them all. (+)
- Sectors were nearly unanimously positive with the exception of energy because of the sell-off in crude and the safety play of utilities. (+)
- Volatility moved lower with energy prices confirming bullish price action. (+)
- The color charts (moving average of stocks above key moving averages) on a short-term and intermediate basis are 100% bullish and bullish to neutral on longer-term readings. (+)
- Risk gauges remain quite strong with 4 of the 5 ratios risk-on with the wood/lumbar ratio being the only hold-out . (+)
- Volatility continued to come off this week and is now in a distribution phase. (+)
- The value vs growth relationship has growth resuming leadership. While both are pushing new recent highs, neither have taken out their all-time highs. (+)
- The modern family continued its recent strength with all of the members back in bullish phases. (+)
- Foreign markets were up sharply and are in bullish phases in both emerging and developed markets with emerging markets testing new all-time highs. Both markets look like they could put in a double top at these levels. (+)
- Bitcoin continued its nascent trend and put in its highest levels since early February. (+)
- Seasonal trends remain strong for April and the next few months. (+)
Neutral
- Market internals all put in new highs this week, continuing the recent trend. The McClellan Oscillator did reach overbought levels. (=)
- The 52-week new high new low ratio surged. It is at an extreme overbought levels on the short-term but otherwise looks very positive. (=)
- Soft commodities remained in their recent trading range from the last month. Copper looks like it has some overhead resistance. (=)
- Gold could be at an interesting inflection point, coming right back up to its 50-Day Moving Average and it will be interesting to see which way it inflects. (=)
- Short-term rates eased a little this week but are still locked into bearish phases and in the midst of a trading range. (=)
Actionable Trading Plan (Based on Current Regime: Strong Risk-On, Short-Term Stretched)
- Core Positioning (Stay Invested, Lean Long)
-
- Maintain a high net long exposure—this is not an environment to fade strength.
- Prioritize leadership: growth, semis, high-beta names, and areas making new highs (including selective EM and crypto proxies).
- Avoid laggards (energy, soft commodities) unless they show clear relative strength reversals.
- Add-on Strategy (Buy Strength, Not Weakness)
-
- Add to positions on continuation moves (breakouts or strong follow-through days), not dips.
- Scale in rather than all-in—momentum is strong, but short-term conditions are stretched.
- Focus on names/sectors confirming with volume (accumulation trends matter here).
- Risk Management (Respect Extension Without Overreacting)
-
- Tighten stops modestly on extended positions—this is where sharp, fast pullbacks can occur.
- If internals deteriorate (e.g., breadth weakens, distribution days cluster), reduce exposure incrementally—not all at once.
- Avoid initiating large new positions if multiple overbought signals cluster simultaneously.
- Rotation Awareness (Watch the Inflection Points)
-
- Monitor gold, copper, and rates closely—any decisive move could signal cross-asset rotation.
- Be alert for early signs of leadership change (e.g., value reasserting, defensive sectors catching bids).
- If volatility begins expanding from low levels, shift from aggressive adds to capital preservation.
- Tactical Hedge / Cash Use
-
- Keep some dry powder (~10–20%) to take advantage of any fast pullbacks.
- No need for heavy hedging yet—volatility is declining—but be ready to act quickly if regime shifts.
- Time Horizon Framing
-
- Short-term (days–weeks): Expect chop or consolidation due to overbought conditions.
- Intermediate-term (weeks–months): Trend remains bullish unless internals materially break.
Bottom Line
Stay long and participate in the trend, but shift from aggressive accumulation to disciplined scaling and tighter risk control as the market gets extended.