


Last week felt like the Kentucky Derby of earnings season, especially if you listened to or read the earnings call transcripts of the big tech stocks I’ll review below.
Last week’s Market Outlook, “Intel Confirms Another Gold Mine Segment In Semiconductors,” explained Intel’s (INTC) remarkable comeback from behind rally, which led it to finally reach its all-time high set back in 2000.
Stock moves like this are in many ways analogous to Golden Tempo’s move from last to winner in the Kentucky Derby this weekend.
Even if you don’t know or care about horse racing, these final 53 seconds of the race are inspiring, Kentucky Derby 2026 Remarkable Finish.
In case you’re wondering what a horse race has to do with picking winning stocks, in both cases, it takes the right leader with the right team in the right conditions to come out on top. Sometimes, a little bit of luck helps.
The Next Golden Tempo Stock
Last week was filled with explosive market action, insightful news, and new timely opportunities in market rotation.
This week’s title asked, “Which Will Double First: AMZN or ORCL?”
I’d like to answer, “GOOGL”, but that’s not the question.
The risk manager in me wants to reply, “That’s not the question you should be asking if you want the best odds of doubling your money with only these two stocks to choose from.”
Finally, the tactical investor in me says, “I’d set up a trade that increases my odds of doubling my money with these two stocks, and bet on doubling it faster by picking the right one.”
Before I get to the answer, let’s look at the insightful news and new timely opportunities that occurred last week, because they both inform the answer to the AMZN vs. ORCL challenge and a whole lot more.
The AI Power Play: 7 Thematic Pillars of Big Tech’s AI Infrastructure Buildout
Last week delivered a slew of earnings reports, including some of the most important companies at the center of the AI infrastructure buildout.
This area of the AI revolution is one of the most influential drivers of the stock market and a reason the historic rise in the price of oil and the crisis over the Strait of Hormuz appear to have been sidelined by the equity index’s determination to move higher.
So I looked at the earnings report conference call transcripts of 8 companies (with the help of AI) that have recently reported earnings to analyze the state of the AI infrastructure buildout with the questions in mind that investors should be asking…
“Will it last, and if so, how big will it be?”
The AI infrastructure buildout is unlike anything we’ve ever experienced. Its impact is felt profoundly in more industries than most people realize, and its reach is spreading like a virus.
The scale and speed at which it can disrupt or create companies, and even entire industries, are unprecedented.
As investors, we need to distill risks from opportunities and facts from fantasy to stick with the trends that will thrive and avoid the inevitable financial disasters that occur during disruptive progress like now.
AAPL, GOOGL, META, AMZN, MSFT, ORCL, TSLA, DELL
I created a report for members of our Opportunity Report service (which is free on our home page) that is too long to repeat entirely here, but I’ll summarize some of it below.
Additionally, in the spirit of the power of AI, I also let Google’s AI product “Notebook LM” create an incredible presentation of the report in a 15-minute podcast format, which you can listen to here.
There are many, even hundreds, of companies that are an integral part of the AI revolution, but this report intentionally focuses on companies that have reported earnings in the last several weeks, and are in a position to shed light on several areas that I’ll describe as themes, or pillars of the AI infrastructure flywheel that provide a framework to decide…
Are we in a bubble or setting the foundation of the “roaring 2030’s”?
Here are the themes:
- AI Capex Is Going Parabolic And 2027 Will Be Bigger Than 2026
- Backlog/RPO Has Reached Numbers That Did Not Exist A Year Ago
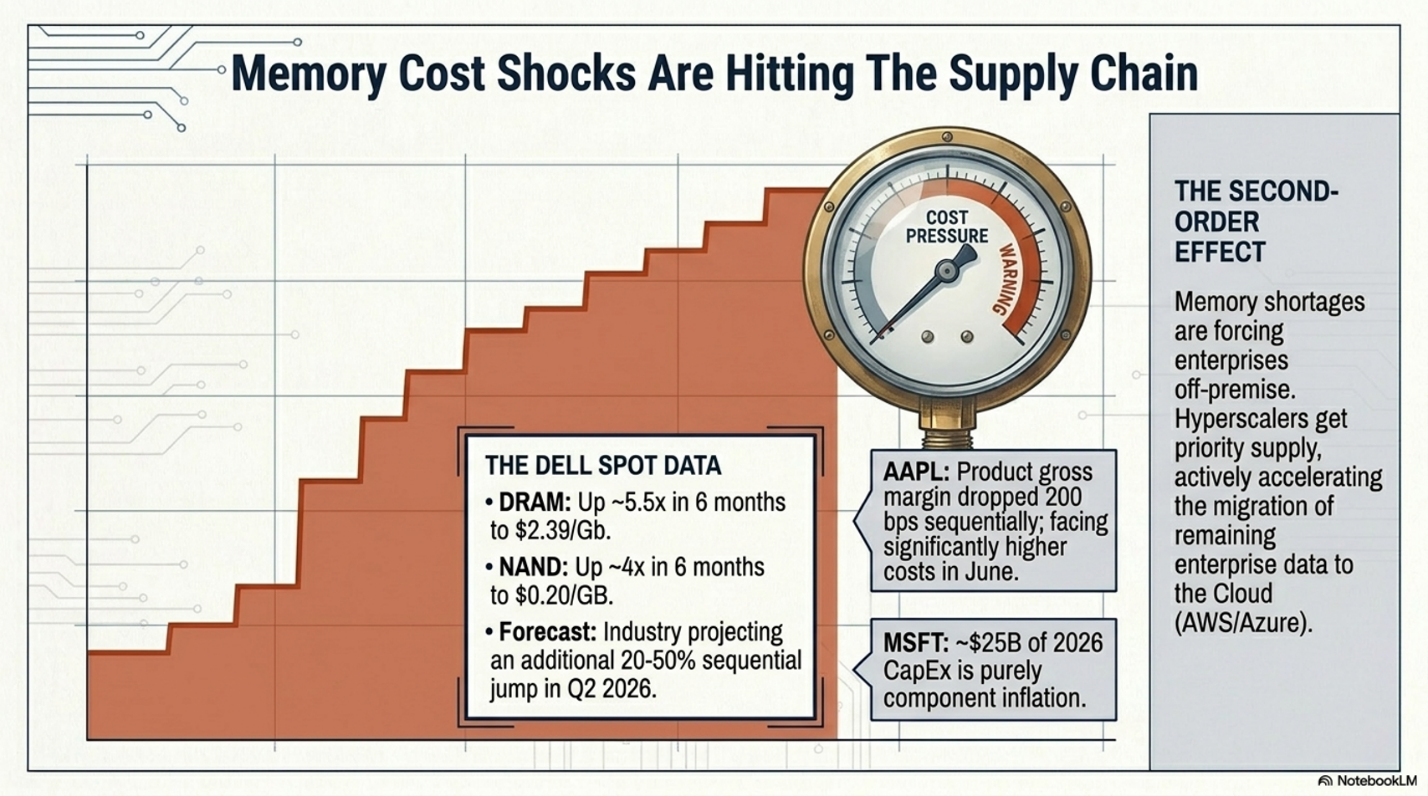
- Memory Costs Are Skyrocketing But Will It Matter?
- Custom Silicon Has Moved From Side Bet To Core Differentiator
- Demand Exceeds Supply Across The Board
- Margins: Capex And Memory Are Showing Up In The P&L
- Supplying Energy To The Data Centers
Every one of these themes has the potential to accelerate or hinder the success of the big picture. While these flywheel themes can evolve and change over time, currently, if you look at the AI infrastructure buildout through this lens, I believe you will be able to anticipate the health of the trend.
Why The Market Has Rewarded This Earnings Season (So Far)
Here’s what’s being said on the conference calls about Capex…
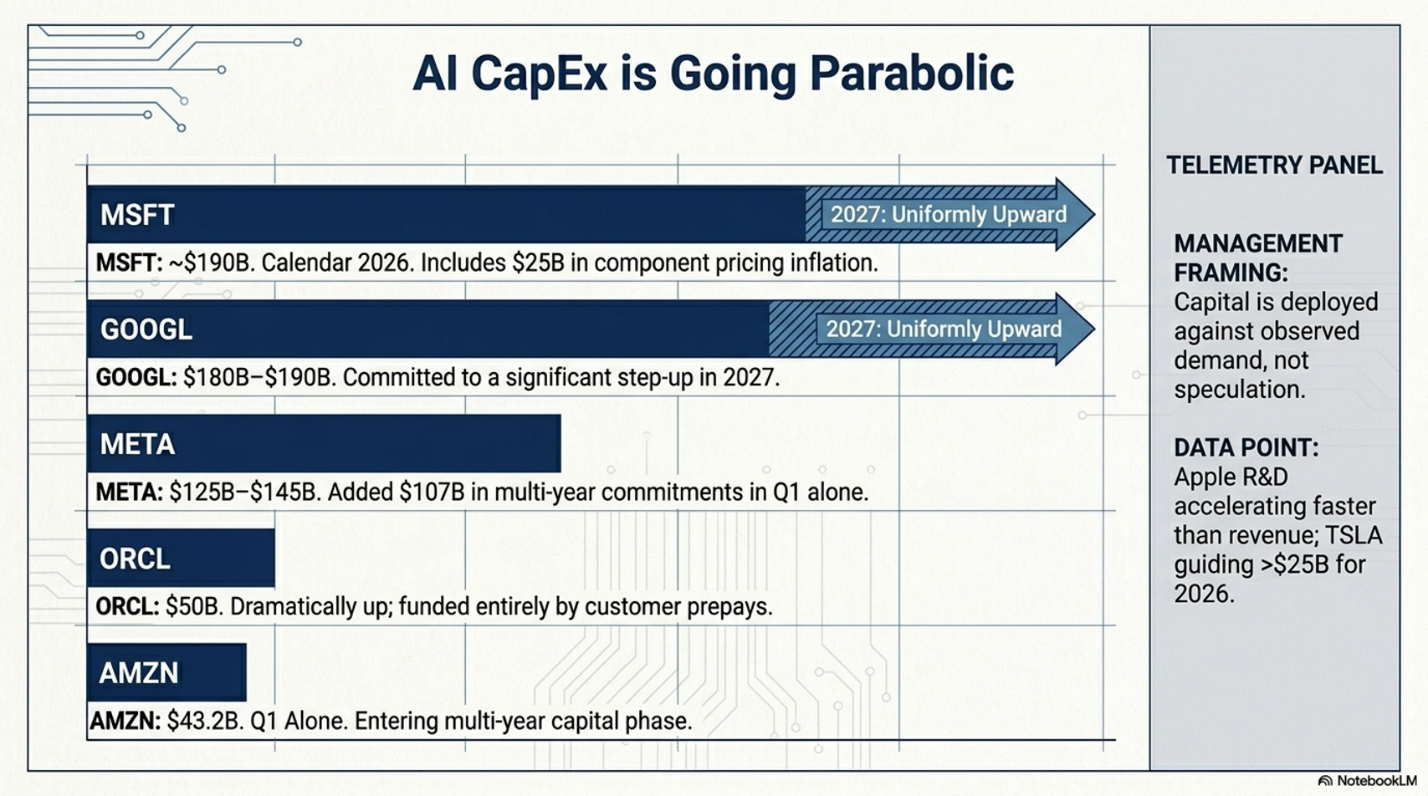
Microsoft (Amy Hood): The FY26 capex spend supports a “book of business… over $600 billion of revenue that we still need to deliver.” She also stated “we expect another year of double-digit revenue and operating income growth in FY27.”
Google (Anat Ashkenazi): The 2027 step-up is being driven by “unprecedented internal and external demand for AI compute resources.”
Amazon (Andy Jassy): “In times of very high growth like now, where the CapEx growth meaningfully outpaces the revenue growth, the early years’ free cash flow is challenged until these initial tranches of capacity are being monetized.”
Yes, Memory Prices Are Skyrocketing, but Companies Are Fighting Back
Here’s what was said on the conference calls about memory pricing…
Apple (Tim Cook): “We will look at a range of options with memory costs increasing” — leaving open the possibility of pricing actions.”
Dell (Jeff Clarke): Dell took company-wide pricing actions: server pricing changed on December 10, 2025, and PC pricing on January 6, 2026, “This notion of we recover our cost in 2/3 of it in 90 days, we moved that quickly. That’s what we learned in COVID.”
Amazon (Andy Jassy): The memory dynamic is “a further impetus pushing companies who have on-premises infrastructure into the cloud.”
Big Spending, higher costs, What’s Happening to Margins?
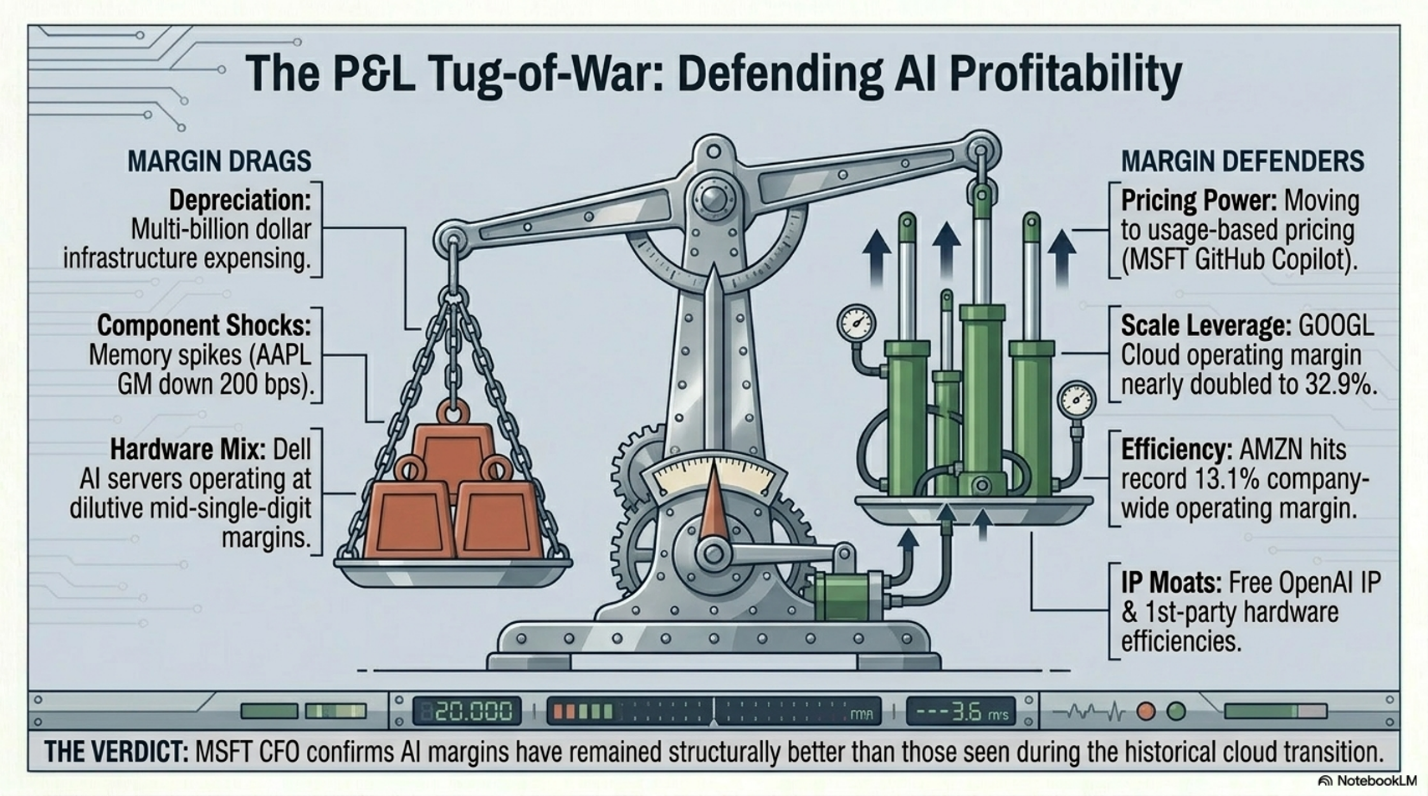
Here’s what was said on the conference calls about margins…
“Worldwide operating income was $23.9 billion, with an operating margin of 13.1%, our highest operating margin ever.”
— Brian Olsavsky, CFO, Amazon (AMZN)
“Cloud operating income was $6.6 billion, tripling year-over-year and operating margin increased from 17.8% in the first quarter of last year to 32.9%.”
— Anat Ashkenazi, CFO, Alphabet (GOOGL)
“We’ve been talking about where this AI business of ours has been in the cycle compared to even the cycle we saw with the cloud, which now seems very long ago, and how margins were actually better. And they’ve remained better in our AI business, versus where we saw in the cloud transition looking back.”
— Amy Hood, CFO, Microsoft (MSFT)
“Products gross margin was 38.7 percent, down 200 basis points sequentially [driven by] seasonal loss of leverage and higher memory costs.”
— Kevan Parekh, CFO, Apple (AAPL)
“ISG operating income was a record $2.9 billion up 41%, marking seven consecutive quarters of double-digit growth… Operating margin was 14.8%, up 240 basis points sequentially.”
— David Kennedy, CFO, Dell (DELL)
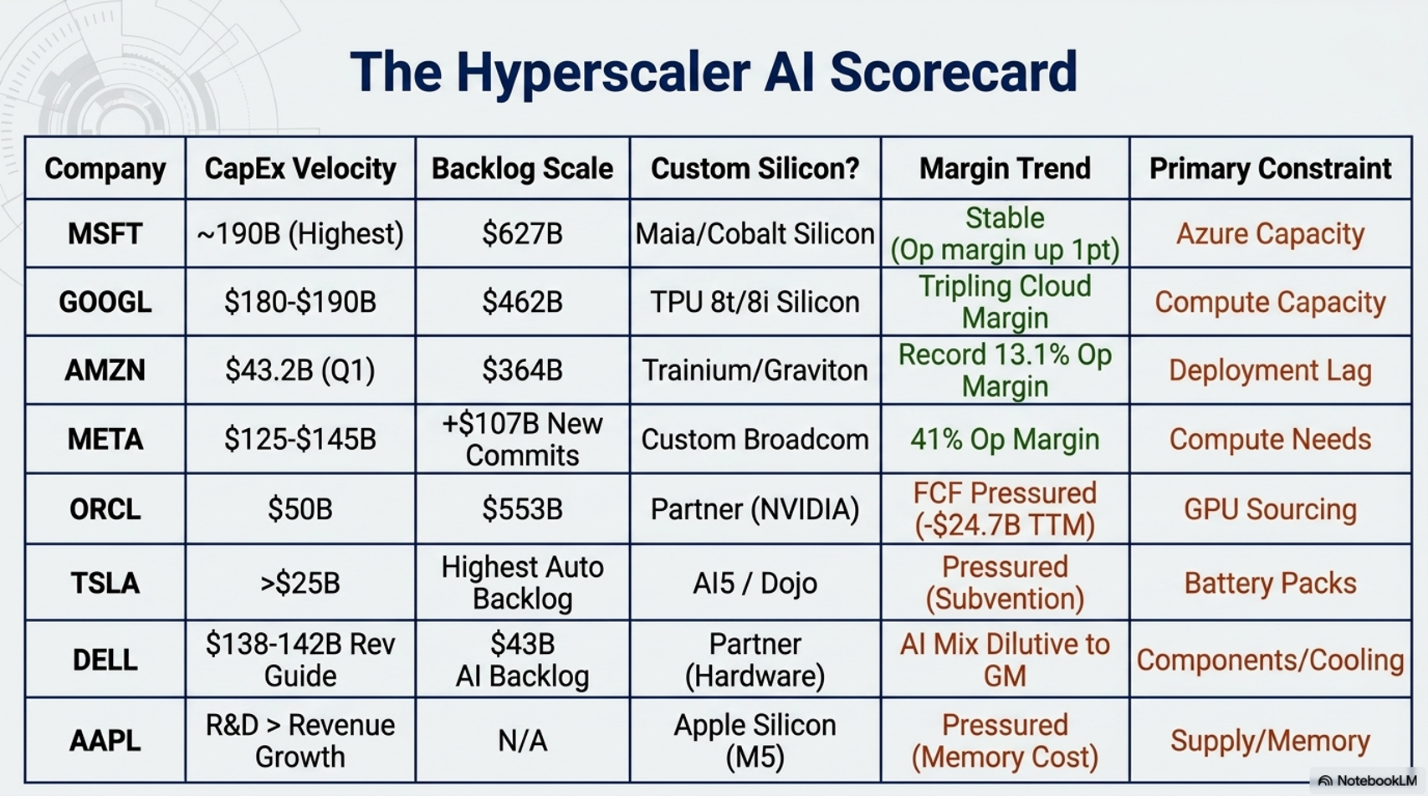
A Summary Scorecard
When you look at the summary matrix below, the overarching themes become apparent.
Capex is supported by the backlog of orders.
The decision to make their own chips has been a big windfall for those who pursued that path.
They’re all being held back by some supply constraint.
AMZN vs ORCL
AMZN and ORCL are both in this group of stocks, and I probably could have picked any two stocks in this group to highlight with the question “which would double first?”
As for the suggestion that, “I’d set up a trade that increases my odds of doubling my money with these two stocks, and bet on doubling it faster by picking the right one.”
I’d bet that holding a position in both stocks would offer the highest odds of success that you’ll double your money. Both are poised to run higher, and they’re starting from very different positions.
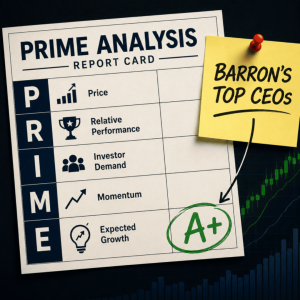
Looking at the PRIME analysis…
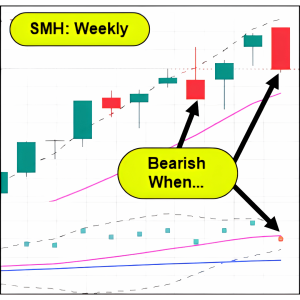
AMZN peaked in early 2025 at $242, and since then it has not been able to break through the $250 area until now. As you can see below, the green box highlights that it has broken out with all four indicators in a bullish condition. Real Motion has green dots and Triple Play Leadership and Volume Trend have good separation between the blue line over the red.
This suggests that this breakout should run and with a consolidation that has lasted well over a year, it’s ready for a big move.
ORCL is a stock that we’ve been looking to turn higher for months. The trigger was the break over the 50 DMA (blue line) in price, but more importantly, the condition for the phase change breakout to be trusted is the Real Motion chart that has had its 10-DMA over its 50-DMA since early 2026.
This break over the 50 happened with all the indicators in bullish conditions.
Not only is ORCL turning up with a positive Real Motion Divergence, but it group of enterprise software companies that have been in an ugly bear market for months are now turning higher with Real Motion Bullish Divergences.
Here’s the IGV chart…
Additionally, both ORCL and IGV are bouncing off their 200-week moving averages
It would not be surprising to see ORCL become a 2026 Golden Temp stock.
Keep your eye on it and the stronger trends in the IGV group.
When you have a PRIME trend with a good growth story, your trades can have the wind at their back for a long time.
If You’d Like To Learn More About MarketGauge Strategies and Systems
If you’d like access to the MarketGauge indicators, strategies, automated trading models, and more, contact us.
- For individual traders or those who want access to professional-grade models: marketgauge.com/call, and ask Rob how to join our Active Investing Edge program
- If you’re an asset manager or RIA seeking algorithmic systems: email Ben at ben@marketgaugepro.com
- Use Big View (a lot of it is free!)
Best wishes for your trading,
Geoff Bysshe
Co-Founder
(Connect on LinkedIn)
 |
| Every week we review the big picture of the market’s technical condition as seen through the lens of our Big View data charts.The bullets provide a quick summary organized by conditions we see as being risk-on, risk-off, or neutral. The video analysis dives deeper. |
Summary: Markets pushed to fresh highs across major indexes with strong breadth, leadership, and declining volatility, keeping the overall trend firmly risk-on with only a modest overextension. However, some cracks are forming beneath the surface—internals are softening, rates and oil remain elevated, and macro crosscurrents like a stronger yen and rising ag commodities suggest potential pressure building even as momentum persists.
Risk On
- Markets continued higher this week, with SPY, QQQ, and IWM putting in new all-time highs and aren’t overbought on price or real motion, aside from the QQQ’s being a bit strong. (+)
- Sectors were mostly positive with Technology, Regional Banks, and Energy leading the way. Homebuilders were off with treasuries down. (+)
- Volume remained strong with on average twice as many accumulation days as distribution days. (+)
- The new high new low ratio remains near its upper levels. (+)
- The color charts (moving average of stocks above key moving averages) look quite bullish in the NASDAQ and fairly bullish in SPY and IWM. (+)
- Risk gauges remain quite strong with 4 of the 5 ratios risk-on with the wood/lumbar ratio being the only hold-out . (+)
- Volatility continued to come off and closed solidly below its 200-Day Moving Average.
- Value and Growth are both attacking new all-time highs and not overbought on price or momentum. (+)
- The modern family has good relative strength with 4 of the six in bull phases, and most of them closing higher on the week. (+)
- Emerging and developed foreign equities are all in bull phases with emerging markets putting in a new all-time high close on Friday. (+)
- Seasonal trends cool a bit in the next few weeks but remain bullish. (+)
Neutral
- The market internals continued to weaken a bit, though they remain slightly bullish. (=)
- Big surge in soft commodity prices with wheat and corn up, likely due to concerns about trade and fertilizer supplies. (-)
- The Yen jumped on an intervention to support the currency. (=)
- Rates pushed a little higher this week, re-testing their recent highs. (=)
Risk-off
- Volume came off pretty strong this week with significantly more distribution days than accumulation days across the board. (-)
- Oil surged to new highs mid-week before coming off slightly, though it remains at very elevated levels with little sign of a clear resolution to the conflict in the Middle East. (-)
Actionable Trading Plan
Base Case: Stay Risk-On (but tighten execution)
Trend, breadth, and volatility all support continued upside.
Core positioning
- Stay net long equities (60–90%)
- Favor beta + leadership:
- Tech / semis (QQQ leadership still intact)
- Regional banks (KRE confirming risk appetite)
- Select energy (but more tactical given volatility)
Execution
- Buy pullbacks to short-term support (5–10 day MA / prior breakout levels)
- Avoid chasing extended QQQ days—let it come in slightly
.
Add-on Trades (high probability setups)
1) Breakout continuation
- Trigger: SPY / QQQ / IWM hold above recent highs for 2–3 sessions
- Action: Add 10–20% exposure
- Target: momentum continuation leg
2) Laggard catch-up (rotation)
- Homebuilders / rate-sensitive names (recent laggards)
- Trigger: rates stall or pull back
- Action: short-term swing longs
3) Commodities (tactical)
- Ags (ties to your DBA question): wheat/corn strength
- Action: small position (DBA or specific grains)
- Mindset: inflation hedge / diversification, not core trend trade
.
Risk Management
You’ve got early warning signals—don’t ignore them:
Yellow flags:
- Internals weakening
- Rates rising
- Oil elevated
- Yen intervention (liquidity tightening risk)
That combo = market still going up, but less forgiving
Adjust how you manage risk:
- Tighter stops than usual
- Swing trades: 3–5%
- Index exposure: below 10–20 day MA or last breakout
- Scale out into strength, not all-or-nothing exits
- Avoid adding risk on late-week extensions
.
Volatility Play
- VIX below 200-day = supportive
Sell fear, not chase protection
Tactic:
- If VIX spikes 10–15% quickly → buy equities into that move
.
Clear “De-risk” Triggers
Shift from Risk-On → Neutral if:
- 52-week NH/NL rolls over sharply
- 2–3 distribution days cluster across indexes
- QQQ loses short-term trend (10–20 day MA)
- KRE / semis lose leadership (your “Modern Family” cracks)
If triggered:
- Cut exposure to ~40–60%
- Rotate to stronger relative sectors only
.
Simple Weekly Game Plan
- Monday–Tuesday
- Look for continuation or mild pullback → add exposure
- Mid-week
- Watch rates + oil → decide if rotation or risk trim needed
- Late week
- Don’t chase strength → scale / rebalance
.
- Don’t chase strength → scale / rebalance
Bottom Line
- Trend = Up → stay long
- Internals/macro = caution → be tactical
- Play offense on pullbacks, defense on extensions
**There will not be a video this week