





Last week ended with SMH closing down for a 9th consecutive day. On paper, this bearish streak is its longest in 25 years, but as we’ll see below, it may not be as bearish as many think.
It also only represents about 1/3 of what’s driving the market, so if that’s your main focus, consider this…
This streak got far more attention than the very unusual 7-day streak of synchronous higher closes in both TLT and USO. In the past 20 years, not only has this never happened; the next closest synchronous bullish streak was 4 days in 2020.
The chart below illustrates the relationship between TLT (long bonds) and USO (crude oil) from a few different perspectives.
The other very notable trend is the sub-chart showing TLT’s consecutive closes in either direction.
It’s noteworthy that the time period of the chart begins just before the war with Iran began. This highlights how much this intermarket relationship has changed in recent weeks, and as we’ll discuss later, it’s probably not a positive indication for stocks.
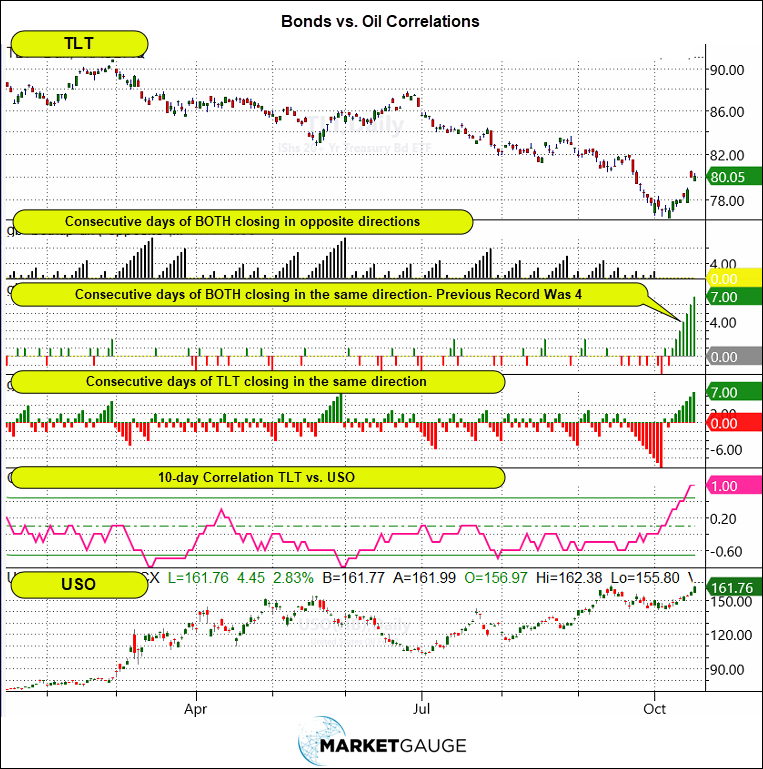
What makes the move up in bonds, along with high crude prices, even more alarming is that last week’s CPI and PPI reports both suggested inflation was hotter than expected.
Higher oil plus higher Inflation data doesn’t intuitively (or historically) lead to higher bond prices.
What’s going on? And what might this mean for stocks?
Before we figure out TLT and USO vs. stocks, let’s look at what going on with SMH vs the whole market.
The Most Bearish Daily Streak in 25 Years. Oversold?
9 consecutive lower closes hasn’t happened in the SMH in 25 years, and it seems a little excessive.
However, if you want to use the SMH as an indicator, you may also want to focus on a few leading stocks to confirm your analysis.
Below you’ll see the chart of correlations between SMH and QQQ.
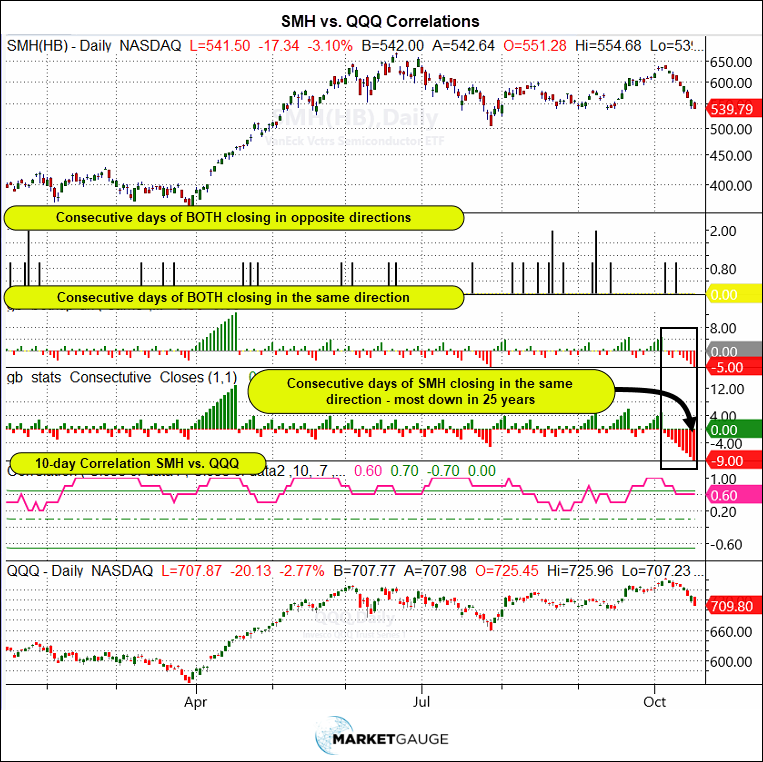
In every metric, the QQQ and SMH clearly move in a positively correlated way, which suggests weakness in SMH will weigh heavily on QQQ.
The Ominous Divergence In SMH
Last Monday in our Active Investing Edge live mentoring, we reviewed an ominous condition in SMH.
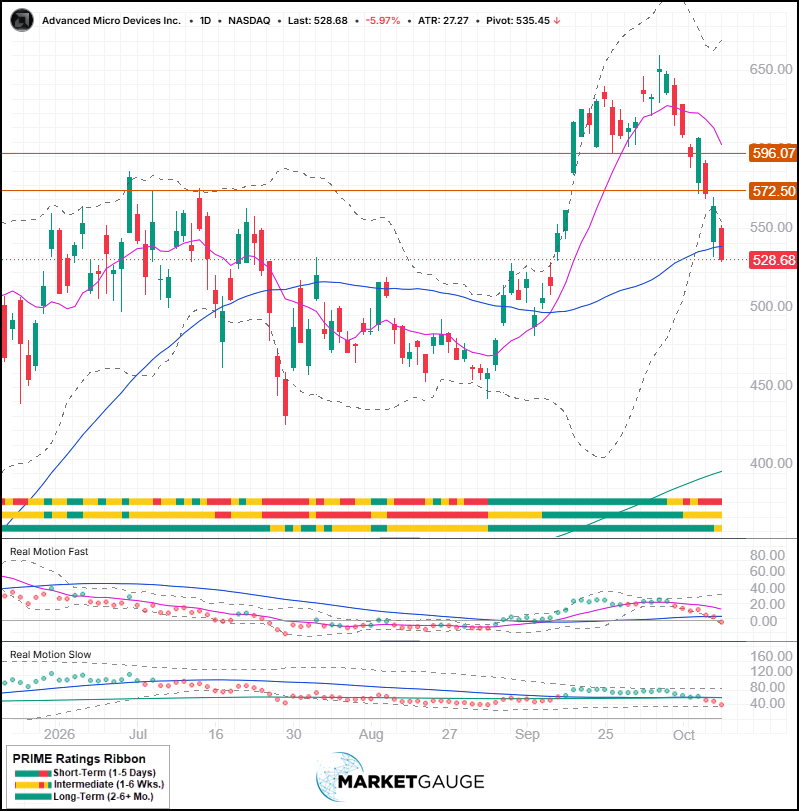
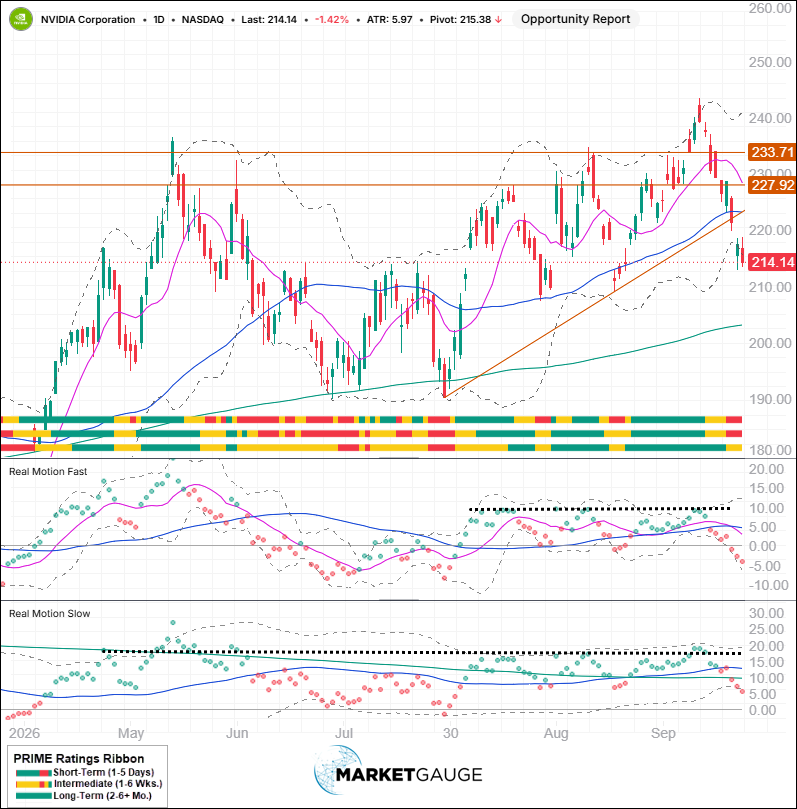
NVDA (20%), TSM (9%), and AMD (6%) represent 35% of SMH. As a result, if you want to know what SMH is likely to do, it’s helpful to look at these 3 stocks relative to SMH.
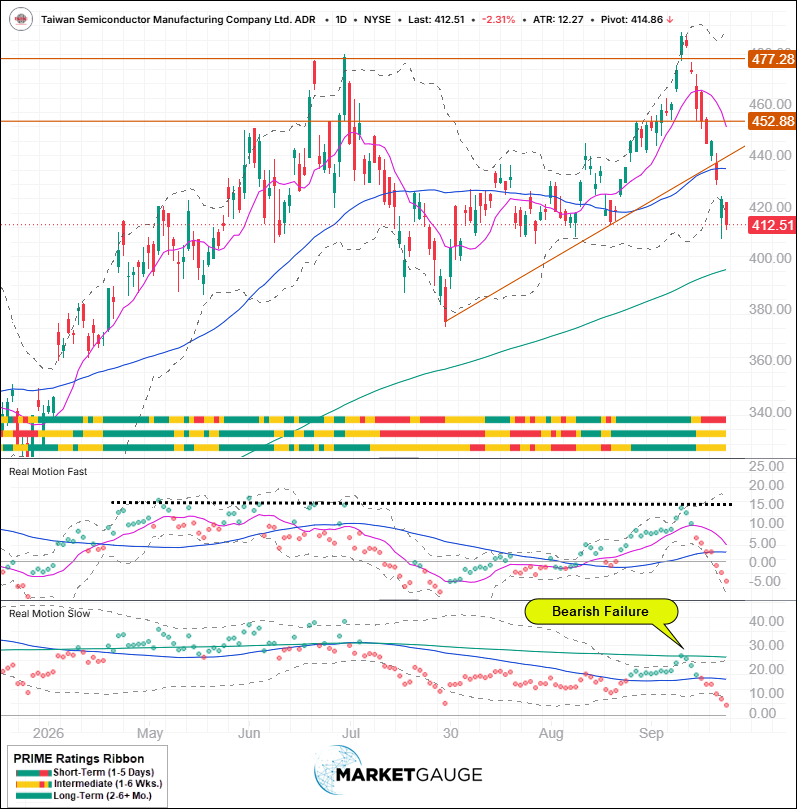
As you’ll see in the charts below, you’ll find the ominous condition that is that all three made new all-time highs in the week before last while SMH didn’t come close to its new high. This means if these three SMH leaders break down, it’s likely that SMH will also break down hard.
Below are the three charts showing horizontal levels and trend lines that should not have broken if the trends were strong.
You’ll also see how their PRIME Ratings Ribbon indicator deteriorated quickly as they pulled back, and how the momentum (Real Motion) charts confirmed the breakdowns with moves from bullish to bearish conditions (red dots).
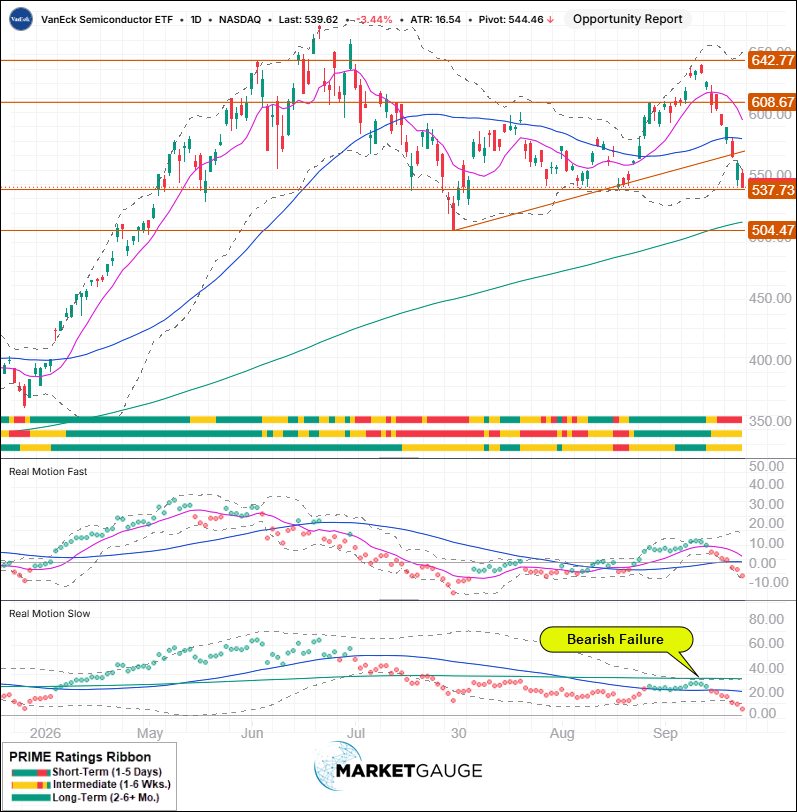
Finally, in both SMH and TSM you’ll see that the slow (50/200) Real Motion charts were unable to rally above their 200-DMA.
In TSM’s case, which hit a new price high, this is a major “bearish failure” pattern that suggests any weakness in price will lead to more weakness. SMH didn’t make a new price high, but it traded well over its 200-day MA in price, and Real Motions did not, which is the same dangerous “bearish failure” as soon as price begins to pull back.
AMD
NVDA
TSM
SMH
To be clear, the divergence was more timely on Monday when discussed with AIE members, but if you focus on the performance of the 3 stocks, it will provide valuable insight and a confirmation tool for being more accurate in anticipating moves in SMH in the future. H
This week, it would be wise to evaluate the key support levels in SMH (537 and 504.50 areas), as illustrated above, and line them up with the respective levels on the three key stocks to watch for divergences.
I believe divergences will occur at this support level because of the conditions we discussed in this article and warned about in last week’s Market Outlook, “Big News For Stocks Under The Bond Market.”
The weakness in the SMH easily suggests that more weakness should be expected both in the SMH and in the general market; however, the move in the TLT last week may suggest that at least a temporary bottom in the bonds is in place as earnings season gets underway.
Did The Bond Market Narrative Just Become Less Bad?
At the start of last week, bonds (TLT) were focused on inflation and, as a result, moved counter to the direction of any large move in crude oil.
Last week, this relationship changed. Bonds rallied as a counterbalance or risk-off asset relative to the slide in tech stocks despite higher that expected inflation data and a significant rally in crude oil.
Not only did bonds rally, but they set a 20+ year record by rallying 7 days in a row, with a 7-day rally in crude oil near its all-time high.
This strength in bonds suggests a new market narrative that supports the idea that either bonds have found the level at which money will flow into higher-yielding bonds rather than stocks, or investors are beginning to fear a slowdown in growth more than higher inflation.
Neither explanation for the rally in bonds bodes well for stocks.
The exception, however, is a scenario where lower yields from higher bond prices lead to a belief that it will support higher stock prices. This would require the market to either adopt the idea that the Fed is not going to raise rates much further or believe that higher Fed Funds rates would not be a headwind for stocks.
Last week’s rally in the RSP, the equal weight S&P 500, suggested that the stock market can rotate in a bullish direction with rising long bonds.
As the media will tend to focus on the expectation for the Fed to hike short-term rates, and inflation’s tendency to push long-term rates higher, if investors are one step ahead, a resilient stock market will likely see long bonds and RSP rally when the cap weighted SPY and QQQ indexes fall.
A weak stock market headed into a bear market will see the RSP and SPY fall, with bonds rallying on slowing growth fears or falling on inflation fears.
As we head into earnings season, the dominant market narrative will likely become the reaction to earnings reports, and the market’s reaction to reports more important than the “beat or miss” of the earnings expectations.
At the same time, listen for the bond market’s reaction to falling stock prices and/or rising inflation. This may be the best indicator of whether to buy stock market dips over the coming weeks.
Want More MarketGauge?
If you’re an individual investor or an advisor, and would like help navigating the ever-changing dominant themes in the market with strategies, tools, automated trading systems or professional advisory services, contact us:
- For individual traders or those who want access to professional-grade models: marketgauge.com/call, and ask Rob how to join our Active Investing Edge program
- If you’re an asset manager or RIA seeking algorithmic systems: email Ben at ben@marketgaugepro.com
- Use Big View (a lot of it is free!)
Best wishes for your trading,
Geoff Bysshe
Co-Founder
(Connect on LinkedIn)
 |
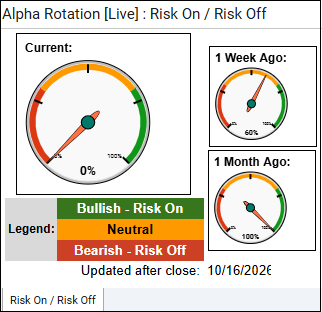 Every week we review the big picture of the market’s technical condition as seen through the lens of our Big View data charts.The bullets provide a quick summary organized by conditions we see as being risk-on, risk-off, or neutral. The video analysis dives deeper. |
Summary: Despite a sharp market sell-off led by technology and semiconductors, improving market breadth, resilient internals, and strength in value-oriented sectors suggest that rotation may be playing a meaningful role alongside broader risk aversion. However, weakening momentum, heavy distribution, rising volatility, surging oil prices, and risk gauges shifting to 100% risk-off warrant a defensive stance until market conditions stabilize.
Risk On
- Despite the nasty sell-off, Market internals bucked the trend with the McClellan Oscillator holding up for the S&P. (+)
- New high new low ratio trending higher and confirming the McClellan Oscillator reading, showing a potential broadening of the market or rotation rather than strict panic selling. (+)
- The percentage of stocks above key moving averages continued to improve off the lows, particularly for the S&P. (+)
- Seasonal trends tend to strengthen into October and into the last part of the year (Most of the time). (+)
Neutral
- Sectors were mixed, with technology (-7.7%) and semiconductors (-10.5%) selling off considerably while we saw about half of the sector up, including retail, energy, and healthcare with strong 3%+ moves. Some healthy rotation mixed in with risk-off in high speculative areas. (=)
- The color charts (moving average of stocks above key moving averages) are starting to show improvements, particularly on the shorter time frames. (=)
- Value and growth switch places, with Value closing in a bull phase and growth slumped into a warning phase. (=)
- Soft commodities pulled back off their highs, dipping below its 50-Day Moving Average. Copper is consolidating and compressing around its highs. (=)
- Gold went from looking heavy to more of a neutral reading. Oil is maintaining a bullish stance and closing at highs this week. A continued move from oil could send waves through the rest of the market. (=)
- The dollar this week hit its highest levels since April, 2025. (=)
- Bonds continued their rebound, gaping higher on Thursday from oversold levels. It’s unclear if this was capitulation or if the dominant trend will continue. We would like to see IEF and TLT break above their 50-Day Moving Averages to indicate more of a capitulation reading. (=)
Risk Off
- Major U.S. indexes took a tumble with QQQ down over -5% and SPY off -2% on the week. Weakening momentum is confirming price action with all four indexes below their 50-Day Moving Average, and IWM below its 200-Day Moving Average. (-)
- Volume patterns were negative with significantly more distribution days than accumulation days across the board. (-)
- Oil was one of the biggest gainers on the week, up over 9%. (-)
- Risk gauges shifted to 100% risk-off. (-)
- Volatility broke out above its 50 and 200-Day Moving Averages and is at a 2-month high. (-)
- The modern family is mixed (weak risk-off), with retail and transportation improving and retail banks holding up, though the other components slipped on the week, particularly semiconductors. (-)
- EFA is in a warning phases and EEM slipped below its 200-Day Moving Average by Friday close. (-)
Actionable Trading Plan
Maintain a defensive posture as weakening momentum, elevated volatility, and risk gauges at 100% risk-off suggest continued downside risk. Reduce exposure to vulnerable growth and technology positions, particularly semiconductors, while avoiding aggressive new entries until selling pressure subsides. Look for selective opportunities in areas showing relative strength, including energy, healthcare, retail, and value-oriented stocks, but keep position sizes modest and stops disciplined. Monitor improving market breadth and internals for signs that the recent sell-off is more rotational than systemic, while watching oil prices, bond yields, and the dollar for additional pressure on equities. A sustained improvement in price action, volatility, and risk gauges would support gradually increasing exposure, but for now prioritize capital preservation, maintain higher cash reserves, and remain patient for clearer confirmation of a market recovery.