


The A.I. story never ceases to keep investors on their toes.
It seems like just a few months ago, any company suggesting it was using AI would be rewarded by the market with billions in new market cap valuation.
Last week, companies were hoping they wouldn’t find themselves in the crosshairs of an AI company or bot claiming it would destroy their business model.
Newberger Berman analyst Joe Amato described an atmosphere in which AI felt like a “heat-seeking missile” targeting new sectors daily.
The AI destruction of market cap began in late 2025 with fears that capital spending would bring down the biggest spenders. Without waiting for proof, investors hammered the Mag 7 stocks (MAGS) on these new fears. ORCL was the canary in the coal mine when it broke below its 50-day moving average in the same week that the QQQ topped with the big cap tech MAG 7 (MAGS), leading the way down. See the chart below.
The peak in the MAGS put a lid on QQQ, but this was only the beginning of the trouble that has since turned into panic in several industries.
The chart below begins when the QQQ peaked on Oct. 29th, 2025, and shows the percentage changes since. As you can see, MAGS drags the QQQ down in the same way it had pushed in the past few years.
IGV (Enterprise Software) also fell sharply in late 2025. This was the beginning of what has increasingly become an obvious and dangerous bearish tone toward AI’s impact on the market.
Last week, fears of AI damaging long-standing business models expanded into wealth management, logistics stocks, and financial stocks, and there were plenty of dire predictions, including Microsoft’s AI CEO claiming that “most if not all white-collar tasks can be replaced by AI within 12-18 months.”
IWM’s late January push to new highs provided encouraging news for the bulls, but its subsequent retreat and the simultaneous new wave of panic-like selling of the IGV created a jittery, sell first ask questions later market environment.
The fear is understandable. If the IGV collapse is the same warning for “white-collar” jobs that ORCL projected for AI spenders, the outlook is frightening.
As Stuart Kaiser of Citi recently noted, the market is grappling with a terrifying realization: if a software business can be “rebuilt in a month on AI,” its traditional value proposition vanishes almost instantly.
We’re not that bearish. AI has become increasingly disruptive, creating a higher degree of uncertainty, and the changes are happening at an accelerating rate.
Wall Street doesn’t like uncertainty that points to multiple compression in certain sectors. Investors also don’t like sudden and extreme volatility. AI is currently fueling both.
How Long Can The Market Hold Up With Tech Weighing It Down?
In last week’s Market Outlook, we covered the rotation away from tech and into more cyclical areas of the market. We also outlined how to stay on the right side of the market and in the best areas of the bull market.
Last week, the market bifurcation became even more pronounced.
The number of stocks and sectors that were under pressure increased over the week, but the strong areas of the market got stronger.
One challenge investors face is that the largest market-cap stocks are weak, so it will take a broader bull market to counterbalance the big-cap drag.
Regardless, the bull market has marched on, but in different areas.
For example, the S&P Equal Weight ETF hit a new high last week. Energy, Homebuilders, Materials, and Industrials ETFs all hit new 52-week highs last week.
You can see the market’s strength in the table below (sorted by year-to-date performance) and available in Big View.
What’s plain to see is that tech (XLK and XLC) is holding the widely followed markets back, and there’s already an impressive spread in performance between what’s working and what’s not.
Is “Defensive” The New Offense?
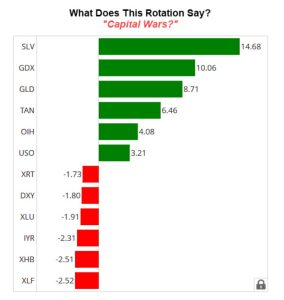
The narrative last week was very clearly that “physical” was a better bet than “digital.” Physical goods and resources can’t be replaced by AI like digital goods and services can be at an alarming rate.
The rush to the physical goods we need, ‘staples’, is typically a sign of recession fears and a defensive investment posture. It’s also been a trade with a limited time frame, because tech and growth have been the secular themes for decades.
However, recession is not part of the narrative, and nor should it be.
Additionally, the growing desire for physical assets has been gaining popularity for years, fueled by an international push to reduce dependence on US financial assets and by the AI intelligence race domestically and internationally.
More specifically…
- There has been a massive accumulation of gold by central banks since the start of the War in Ukraine. This has fueled an increase in retail demand driven by inflation and geopolitical uncertainty.
- More recently, amassing critical minerals has become a geopolitical policy mandate in many countries in the interest of national security.
- Finally, the increased construction required to build out the AI-related infrastructure, such as data centers and their requirements for power generation, is creating strong demand for physical materials and physical labor at an accelerated rate.
Will The Pivot To Physical Goods Continue To Support a Bull Market, or
Will AI’s Disruption of Tech and White-Collar Services
Kill The Bull Market, The Economy, and More?
This multi-part question is too much to answer in this edition of Market Outlook, but we will unravel it in the coming weeks as…
- AI capabilities evolve
- The tech infrastructure buildout progresses
- The real energy needs emerge
- Domestic and international politics influence the playing field
For now, let’s start with the first question: “Can the physically focused sectors outperform weak digital and tech sectors by enough to keep the bull market alive and well?”
That question assumes that if tech continues to weigh on the market, the cap-weighted indexes and ETFs like SPY and QQQ will decline unless other sectors extend their absolute and tech-based relative performance. More details on that below.
There is another bull market option, which is rolling sector bull markets push equal-weighted indexes like RSP (S&P 500 equal-weighted) higher. This is the current state of the market as described above.
Can it continue? See below.
Below are charts showing the spread between the leading sector ETFs and the technology ETF (XLK).
If the chart is moving up, the Sector ETF is outperforming the XLK.
As you look at these charts, consider the following:
- Is it a level that it’s responded to (reversed or broke out from)?
- Is it at an extreme?
- If the data is available, how did this ratio perform in the early 2000’s when a big portion of tech was under pressure?
- If it has been trending, has the trend been profound and
stable, or erratic? - Does it look like a reversal that will last?
In our more rigorous analysis inside our premium active trading services, we stay on top of sector rotation trends with the same 5 measures you can see in the Sector Summary charts:
- Market Phases and price patterns
- Long-term momentum (Real Motion based on the 50 and 200-day periods)
- Intermediate-term momentum (Real Motion based on the 10 and 50-day periods)
- Triple Play Leadership trends
- Triple Play Volume trends
In our algorithmic models that trade leaders in S&P 500, Nasdaq, and small-cap stocks, we use our TSI (Trend Strength Indicator), which provides trend, momentum, and relative performance measures. In some models, we also factor in fundamental trends like earnings growth, analyst ratings, earnings estimates, etc.
The use of TSI in these models intentionally enables exposure to leading sectors via the stocks within them.
TSI provides the same tactical selection ability in our sector and global assets ETF models.
If you’re a member and have access to our discretionary tools or algorithmic model portfolios, consider them along with the charts below.
Consider the following relationships to technology (XLK):
Consumer Staples (XLP) vs. XLK:
The biggest weight in this sector is WMT, and it’s using AI across all areas of its business to do what it does best: reduce costs and charge lower prices to sell consumers everything they need in their daily lives (groceries, clothes, electronics, housewares, etc.).
Are staples rallying because they are defensive, or will the use of AI turn them into more efficient tech-enabled companies worthy of higher multiples.
Retail (XRT) / XLK:
The rally in 2021 is one in which retail dramatically outperformed tech. It can happen.
Homebuilders (XHB) / XLK:
Is this a base with bullish double bottom?
Energy (XLE) / XLK:
If this chart were a popular tech stock, it would not stay down for long. The demand for energy will almost certainly increase if AI growth continues.
Utilities (XLU) /XLK:
Historically seen as defensive, but has recently become more tied to growth stocks in the energy sector. Double bottom?
Financials (XLF) / XLK:
This sector could become a new tech-led sector that leverages the capabilities of AI, but will that mean smaller AI companies disrupting larger rivals, or like WMT in retail, with the best capitalization come out on top? Either way, there’s a bull case to be made for this rati to trend higher.
Industrials (XLI) / XLK:
If tech hardware becomes the growth area, and energy needs increase, industrials should benefit.
Gold Miners (GDX) / XLK:
Looks historically undervalued, and strong arguments for higher gold prices add to the case that its uptrend could continue. Energy costs may become a headwind.
Semiconductors (SMH) / XLK:
SMH includes a blend of companies that make the actual processing chips, storage, and memory. It also includes the companies that design the chips and others that build the machines that make the chips. If there is one sector that represents the health of physical tech, this is it.
When you consider the ratio trends above alongside the health of the individual sector’s trend (i.e. XLI). You can anticipate the best areas of the market to look for opportunities and the odds of the general market providing a tailwind or a headwind for your portfolio.
Want Better Tools, Trading Systems and Market Insight?
If you’d like access to the MarketGauge indicators, strategies, automated trading models, and more, contact us.
- For individual traders or those who want access to professional-grade models: www.marketgauge.com/call, and ask Rob how to join our Active Investing Edge program
- For asset management or RIAs seeking algorithmic systems: email Ben at ben@marketgaugepro.com
- Follow me on Linked In,
Best wishes for your trading,
Geoff Bysshe
 |
| Every week we review the big picture of the market’s technical condition as seen through the lens of our Big View data charts.The bullets provide a quick summary organized by conditions we see as being risk-on, risk-off, or neutral. The video analysis dives deeper. |
Summary: Markets are still broadly risk-on, with leadership in the DOW/IWM and especially strong foreign equities, while S&P internals remain resilient as the advance-decline line hit new highs despite this week’s pullback. However, risk-off signals are building—momentum has weakened across all major indexes, volatility and defensive leadership are rising, and seasonality is turning less favorable, suggesting a more cautious environment even as growth looks oversold.
Risk On
- The rotation into DIA and IWM still remains positive and both are also positive YTD. The longer-term trend (weeklies) remain intact across the board. (+)
- Foreign equities like Korea, Vietnam, and others in Asia were up over 5% this week. (+)
- Despite the sell-off this week, market internals for the S&P held strong and the advance-decline line hit new all-time highs. (+)
- The modern family looks strong across the board, though in some sectors momentum is weakening. (+)
- Foreign equities made new highs this week with positive momentum and strongly leading verses US markets. (+)
Neutral
- Sector rotation shows a roughly even distribution between up and down sectors. Though the best performing sectors this week were typical risk-off sectors like utilities and gold miners. (=)
- The NASDAQ market internals were more mixed.
- The new high new low ratio perked up a bit on the current reading to neutral. (=)
- The color charts (moving average of stocks above key moving averages) weakened across the board. (=)
- Value continues to make new highs in a strong bull phase, while growth closed below its 200-Day Moving average. Growth is oversold on price and real motion. (=)
- Aggs and copper remain in their recent trading ranges. (=)
- Gold held up relatively well and had a new high close on the weekly charts, indicating continued caution and we could start to see some divergence between the metals and equities. (=)
- Bitcoin recovered nicely on Friday, but needs to clear $71k to prove this bottom. (=)
- Rates are indicating future easing with some important breakouts above trendlines set last November. (=)
Risk Off
- All four key indexes are under their 50-Day moving average of momentum on the Real Motion indicator. (-)
- Both the McClellan Oscillator and the New high new low ratio remains negative for the NASDAQ Composite with much lower absolute levels than the S&P. (-)
- Risk gauge flipped to risk-off with the strength in Utilities and stronger performance in TLT. (-)
- With the exception of the DOW, Volume patterns remain weak. (-)
- Volatility revisited the highs from its recent spikes in January and early February. (-)
- Seasonally, we are headed into one of the weaker periods of the year for equities. (-)
Actionable Trading Plan
1) Stay invested, but shift positioning defensive.
Maintain equity exposure, but overweight DOW/value and IWM strength while reducing aggressive growth/Nasdaq exposure until momentum improves.
2) Use foreign equities as a leadership signal.
Favor the strongest international themes (Asia/emerging leaders) as long as they continue making new highs and outperforming U.S. indexes.
3) Treat growth as a tactical “bounce trade,” not a trend trade.
Growth is oversold and may rally, but until it regains key trend strength, keep it as a smaller allocation and require confirmation before adding.
4) Respect the rising risk-off backdrop.
With Real Motion momentum below trend across indexes, weak volume, and volatility elevated, tighten risk management: smaller position sizes, quicker profit-taking, and tighter stops.
5) Use utilities/TLT strength as a warning system.
If Utilities and TLT continue leading, assume risk appetite is deteriorating and reduce equity exposure further.
6) Keep metals as a hedge, not a core bet.
Gold holding up and making weekly highs suggests caution—maintain a hedge allocation to gold/miners in case equities weaken.
7) Bitcoin is neutral until it proves the bottom.
Only add crypto exposure if BTC clears $71k; otherwise treat the move as a countertrend bounce.
8) Prepare for seasonal weakness.
Into this weaker seasonal window, prioritize capital preservation: avoid chasing breakouts, rotate into leaders, and be ready to raise cash quickly if internals deteriorate.