





Last week’s news flow was so flooded with reporting on the fall of Jenson Huang that it was easy to miss the news that will likely be more important in driving the broader market direction over the coming months.
With the coming months being some of the most seasonally bullish, you don’t want your focus on market factors to be distracted by scandals.
Not to mention that during these next few months we’re likely to see compelling evidence of what we described as the “changed game” in last week’s Market Outlook, “The AI Bull Market Isn’t Over. The Game Has Changed.”
In fact, the fall of the man who could be considered the most influential person in accelerating the AI infrastructure build-out will likely increase the importance of the next phase of the AI race.
Remarkably, markets were quick to figure this out last week. As always, insight into what will happen next wasn’t in the news, but in the markets’ reactions.
Additionally, while stocks have been focused on the midterm elections and the fall of Jenson Huang, the bonds, currency, and energy markets have been making historically significant and potentially market-impactful moves which seem to be underappreciated by the current market narrative.
These moves are likely to provide headwinds and tailwinds to the stocks and sectors likely to lead the market in a post Jenson Huang world.
Despite The Fall From Grace by both SMH and Jenson, Stocks Rallied Last Week
As you can see from the table below, the majority of sectors and all major US stock indexes rallied last week, despite what felt like a very bearish news flow.
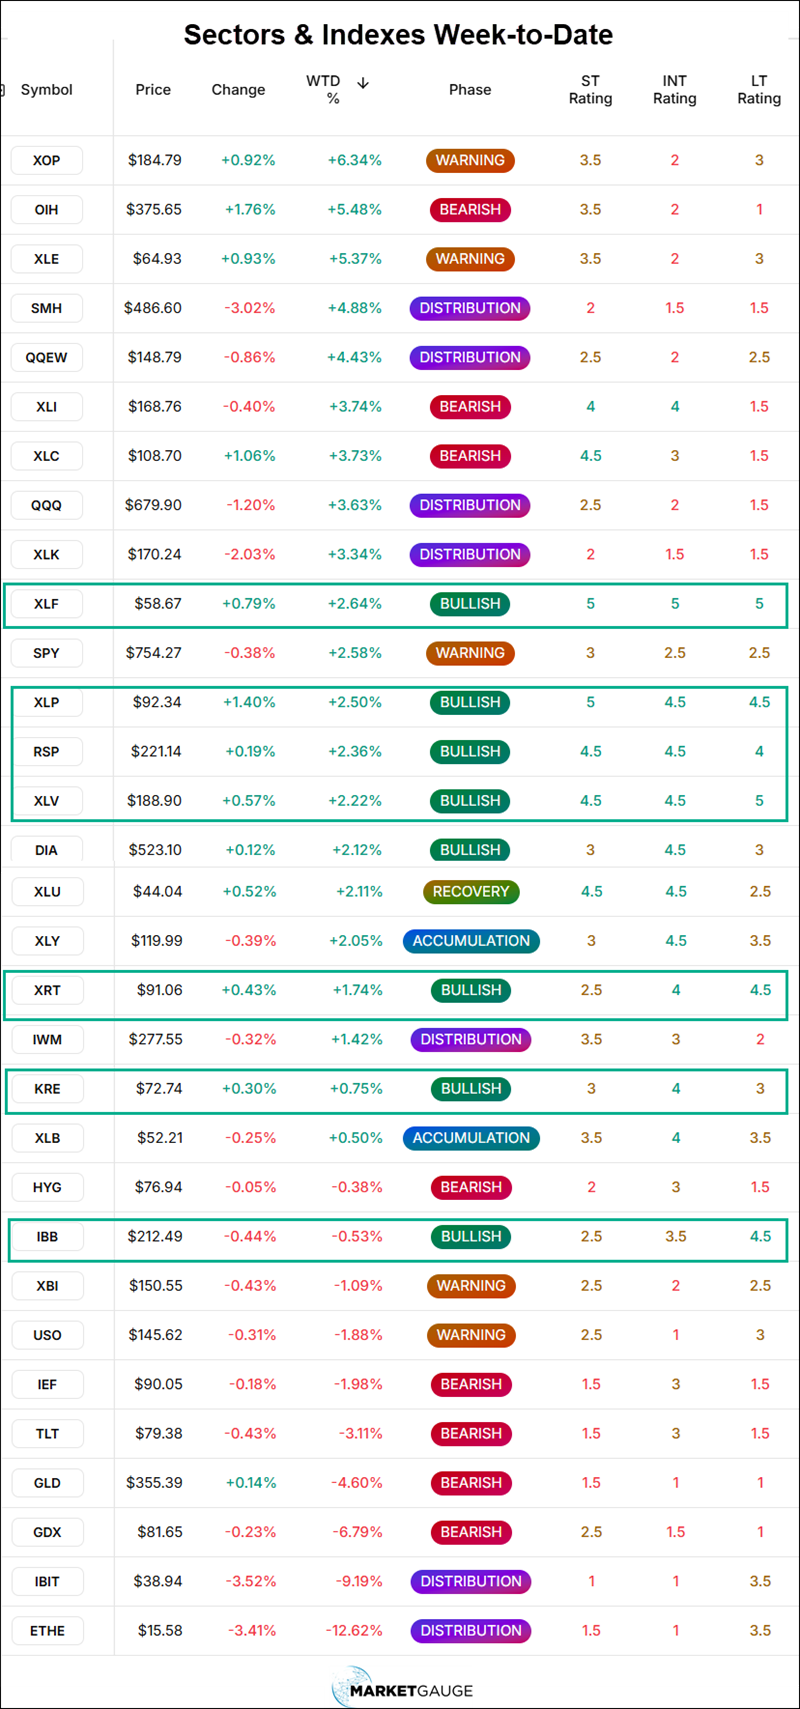
Perhaps most impressive is the fact that SMH rallied almost 5% while its largest component, NVDIA collapsed 12% for the week.
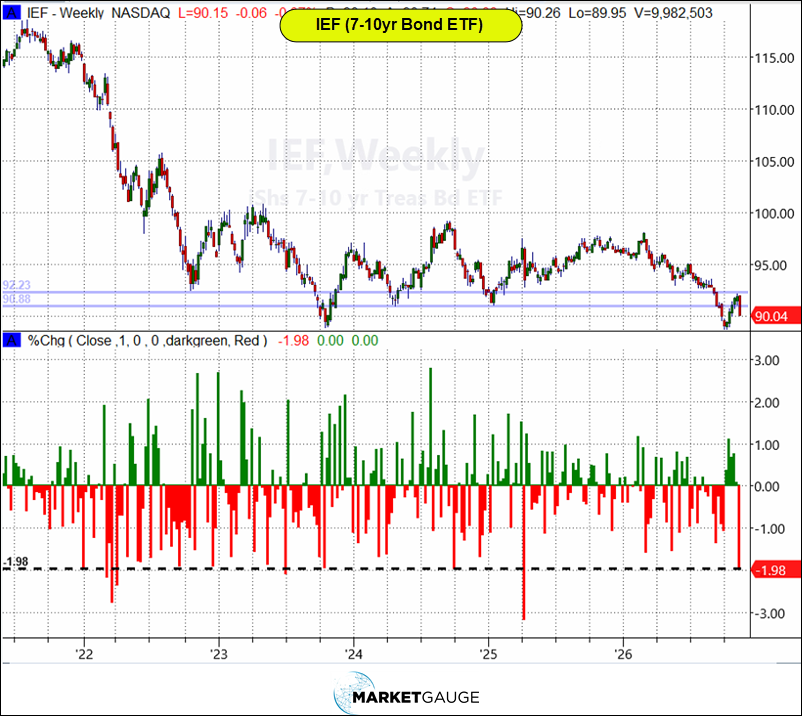
Additionally, bonds had a historically bearish week (see chart below), and the major equity indexes shrugged it off and posted over 1% gains even by the rate sensitive IWM.
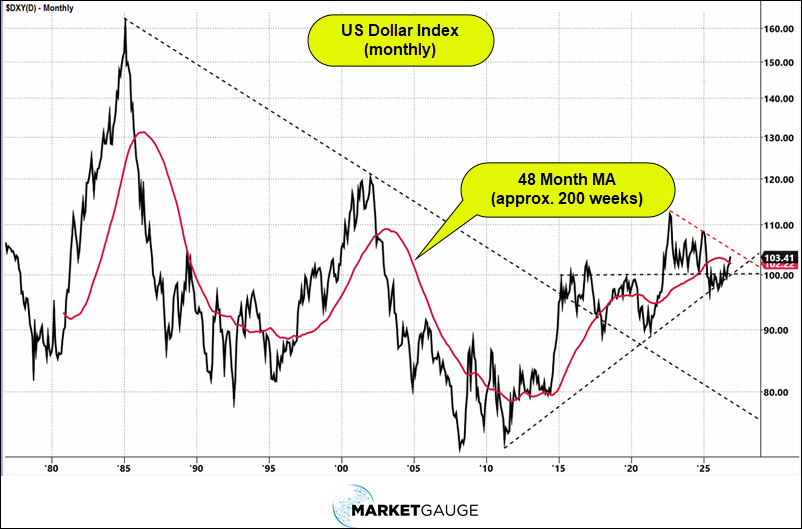
Finally, the US Dollar Index crossed a major milestone (see chart below), which historically has led to significant moves higher.
The chart below is a monthly chart of the US Dollar index. The 48-month moving average is shown to illustrate how timely it (and the 200-week MA) has been at defining key inflection points in major trends.
Below you’ll see a more specific view of the US Dollar ($DXY) on a weekly chart with the 200-week MA. In this chart, you can see that last week the $DXY broke the 200-week MA significantly, and if it follows through, it will also take out key swing highs from 2020 and 2016, which have been significant levels.
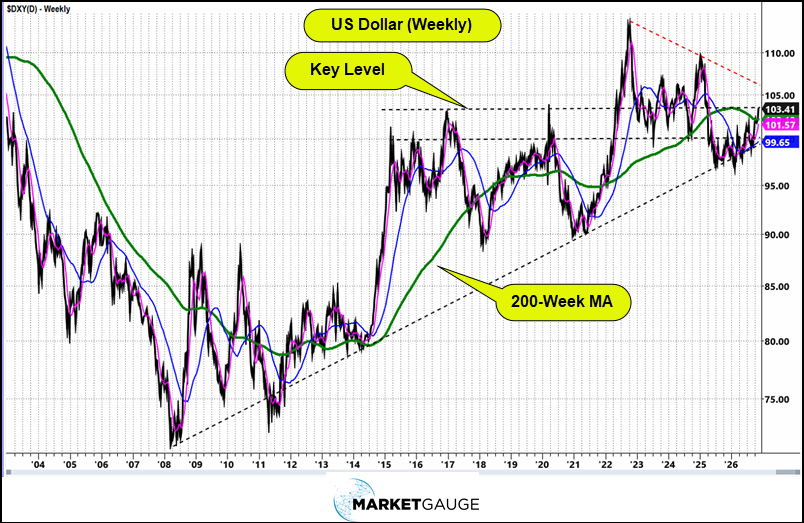
I don’t spend a lot of time focused on the dollar in Market Outlook because it’s not typically the major driver of stock prices. However, its current strength and technical suggestion that its trend could accelerate higher may support a few factors that could become narratives that could drive stocks higher:
- Downward pressure on oil prices and inflation for the US consumer
- Strong economic growth
- Continued ability for the US to attract foreign capital
In a week when Treasury bond auctions were weak and bond prices fell at an alarming rate (see chart above), it’s comforting to see the dollar finish the week strong.
Stocks & Sectors That Will Win In A Post Jenson Huang World
In recent issues of Market Outlook we’ve covered the belief that the fundamental story behind the AI infrastructure buildout is a trend that will remain in place for some time, but that the stocks that have led the market with this as their Expected growth story (the E in PRIME) have rolled over in other areas that are needed to sustain quality stock trends as defined by our PRIME analysis (Price trend, Relative strength, Institutional demand, and Momentum).
The ousting of Jenson from NVDA has just put more pressure on an already weakening segment of the market.
Fortunately, the market has begun to build momentum in the next cohort of AI-related stocks that can lead the bull market higher. These companies are not limited to one sector, but there is some concentration in tech software, financials, manufacturing, retail, construction, and healthcare.
The next cohort of great active investing opportunities in the AI revolution is happening now in the stocks of companies that are the “AI adopters.” These are the companies using AI to drive strong growth, expand margins, and create new businesses, but most won’t be as obvious as the AI infrastructure stocks that exploded higher when they were associated with AI.
Bad news, fear, and failure get more attention in the media, so that will almost always be the lead story. As a result, as the AI infrastructure stocks cool off, the media has focused on what’s falling rather than where the market’s constructive rotation is identifying the next opportunity.
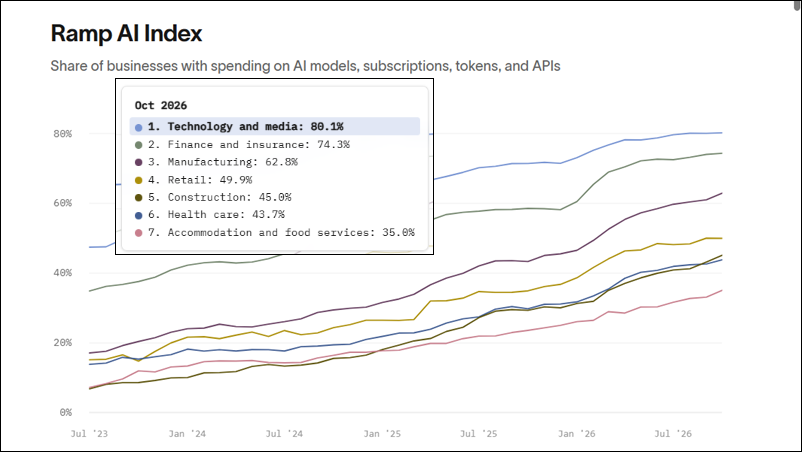
However, while naysayers fail to find ROI, businesses of all sizes in most industries continue to demonstrate they see its value.
As the chart below shows, these industries have shown a willingness to adopt AI.
In a recent interview on Bloomberg Surveillance, Michele Weaver from Morgan Stanley said,
”We did an analysis where we looked at 18,000 transcripts and found that over the last 12 months, 44% of S&P 500 companies are now quantifying the benefits they are seeing from AI adoption. That is up from 32% a year ago.”
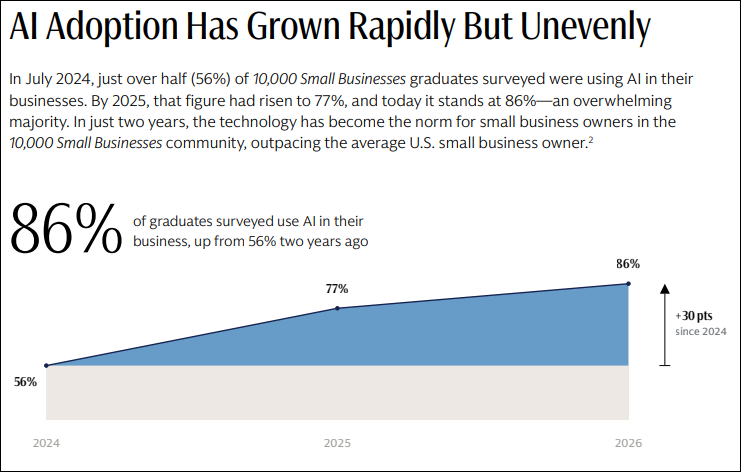
In a recent report by Goldman Sachs, based on over 2,400 company respondents in its “10,000 Small Businesses” graduates, 86% of the companies use AI.
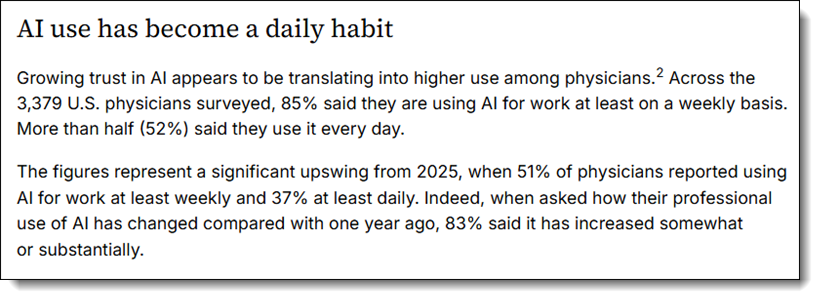
In the healthcare industry, a recent report by Doximity reported…
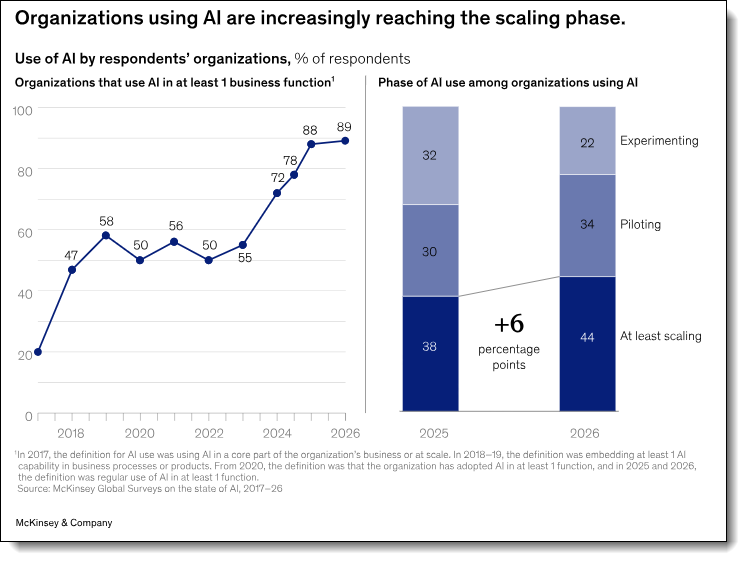
A recent McKinsey report shows that large organizations have not only adopted AI, but have also moved increasingly toward scaling its use…
How To Identify Winning AI Adopters
For the health of the market, the fact that there has been rotation from cooling semiconductor-related stocks into other industries is critical.
Bear markets take over when there aren’t enough durable, non-defensive leaders. That is not the case right now.
The PRIME factors of a trend identify stocks or sectors with the qualities of durable leadership trends by requiring outstanding relative performance, good price trends, institutional demand, and positive momentum.
Look for these qualities in companies that have an “E” expected growth story, grounded in the adoption of AI, to identify the bull market’s next hot AI trend trades.
However, most non-defensive companies with strong PRIME factor ratings right now are candidates for new market-rotation trend trades. If they have an “E” grounded in AI adoption, they’re even stronger candidates for extraordinary moves.
In the Sectors & Indexes table above, there are several sectors (identified by the green highlights) with strong PRIME analysis trends.
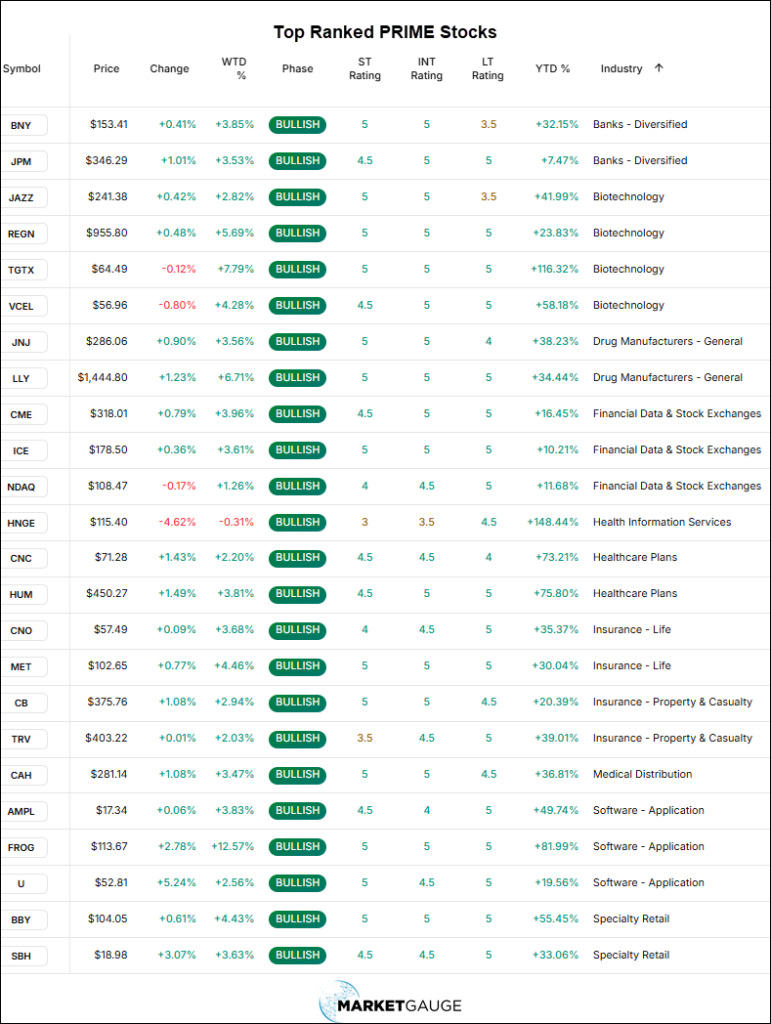
Below you’ll find a selection of stocks in these sectors with strong PRIME ratings.
Want More MarketGauge?
If you’re an individual investor or an advisor, and would like help navigating the ever-changing dominant themes in the market with strategies, tools, automated trading systems or professional advisory services, contact us:
- For individual traders or those who want access to professional-grade models: marketgauge.com/call, and ask Rob how to join our Active Investing Edge program
- If you’re an asset manager or RIA seeking algorithmic systems: email Ben at ben@marketgaugepro.com
- Use Big View (a lot of it is free!)
Best wishes for your trading,
Geoff Bysshe
Co-Founder
(Connect on LinkedIn)
 |
 Every week we review the big picture of the market’s technical condition as seen through the lens of our Big View data charts.The bullets provide a quick summary organized by conditions we see as being risk-on, risk-off, or neutral. The video analysis dives deeper. |
Summary: U.S. equities rebounded strongly this week, supported by broad sector participation, strengthening risk gauges, and favorable seasonal trends, though small caps and semiconductors remain technically weak. Despite these encouraging signs, mixed market internals, persistent growth-stock weakness, elevated volatility, and deteriorating trends in international equities, bonds, and Bitcoin suggest the recovery remains fragile and warrants a cautious approach.
Risk On
- Sectors had a strong week with broad participation, including technology. Energy was the strongest sector, up over +5%, normalizing from the big drop the prior week. (+)
- The modern family is improving, with 3 members in bull phases and most up on the week. Semiconductors and small caps are the two weakest, both under their respective 50 & 200 Day Moving Averages. (+)
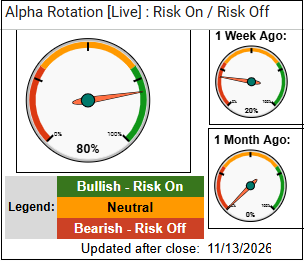
- Risk gauges surged to 80% with the relative strength in equities to gold and high yield to treasuries. (+)
- The color charts (moving average of stocks above key moving averages) are positive across most short and medium-term timeframes, while the longer-term is still mixed. (+)
- Seasonal trends tend to strengthen into November and into the last part of the year (Most of the time). (+)
Neutral
- Major U.S. indexes were up this week between +1.4% (IWM) to +3.6% (QQQ), rebounding off the prior week’s lows. DIA is the only index above its 50 & 200 Day Moving Averages. (=)
- Volume patterns remain mixed with all indexes having about the same number of accumulation days as distribution days and low total numbers of both. (=)
- Market internals drifted back into neutral territory, particularly the McClellan Oscillator, which closed the week just below zero. (=)
- New high new low ratio has been trending higher for the last month, though this week’s price action had all the moving averages start to slope negative. (=)
- Value is trading near its highs while growth is languishing at its 200-Day Moving Average, a sharp divergence that started in early October. (=)
- Soft commodities bounced back a little on the week but remains in a distribution phase, perhaps signalling lower inflation risks. Copper was also weak.(=)
- Gold re-tested its October lows. (=)
- Oil is significantly off its recent highs, though the price stabilized this week. (=)
Risk Off
- Volatility spiked around the election and has come back down to its 200-Day Moving Average, but remains elevated relative to the last few months and trending higher. (-)
- Both Emerging and Developed markets are struggling with developed markets clinging to its 200-Day Moving Average while emerging markets bounced a little from oversold conditions but remain in a weak phase. (-)
- Bonds gave back some of their recent strength. After holding higher levels for a couple weeks, they have now dipped back below their downwardly sloping 50-Day Moving Average (-)
- Bitcoin’s trend lower accelerated this week, breaking below $70k. There could be some support around $65k. (=)
Actionable Trading Plan
Maintain a cautiously optimistic approach as improving market breadth, stronger risk gauges, and favorable seasonal trends support the potential for a continued year-end rally. Look for selective buying opportunities in sectors and stocks demonstrating relative strength, particularly value-oriented areas, while remaining cautious on growth, semiconductors, and small caps until they reclaim key moving averages. Favor incremental position sizing and avoid aggressively increasing exposure until market internals, volume patterns, and volatility confirm the recovery. Maintain appropriate cash reserves, use disciplined stops to manage downside risk, and be prepared to increase exposure if the major indexes reclaim their 50-Day Moving Averages and broader market participation continues to improve.
**There is no video this week.